Requirements
Define mission objectives, required sensors, success criteria, data products, and public-release boundaries.

PAYLOAD SYSTEMS ENGINEERING
Every gram competes with another sensor. Every watt competes with recording time. Explore the hardware, then work through the trade-offs that shape a student-built balloon payload.
Values follow the supplied Spring 2026 launch-acquired-data presentation. Older raw-record and fitted-altitude analyses remain separate team working materials. View the research figures.
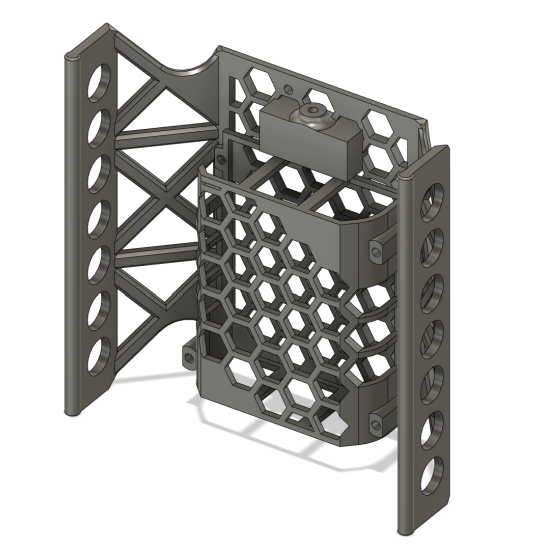
The carrier makes mounting and service access visible before fabrication. Compare fastener access, cable routing and instrument clearance as part of a fit review.
Explore the 2025 engineering record →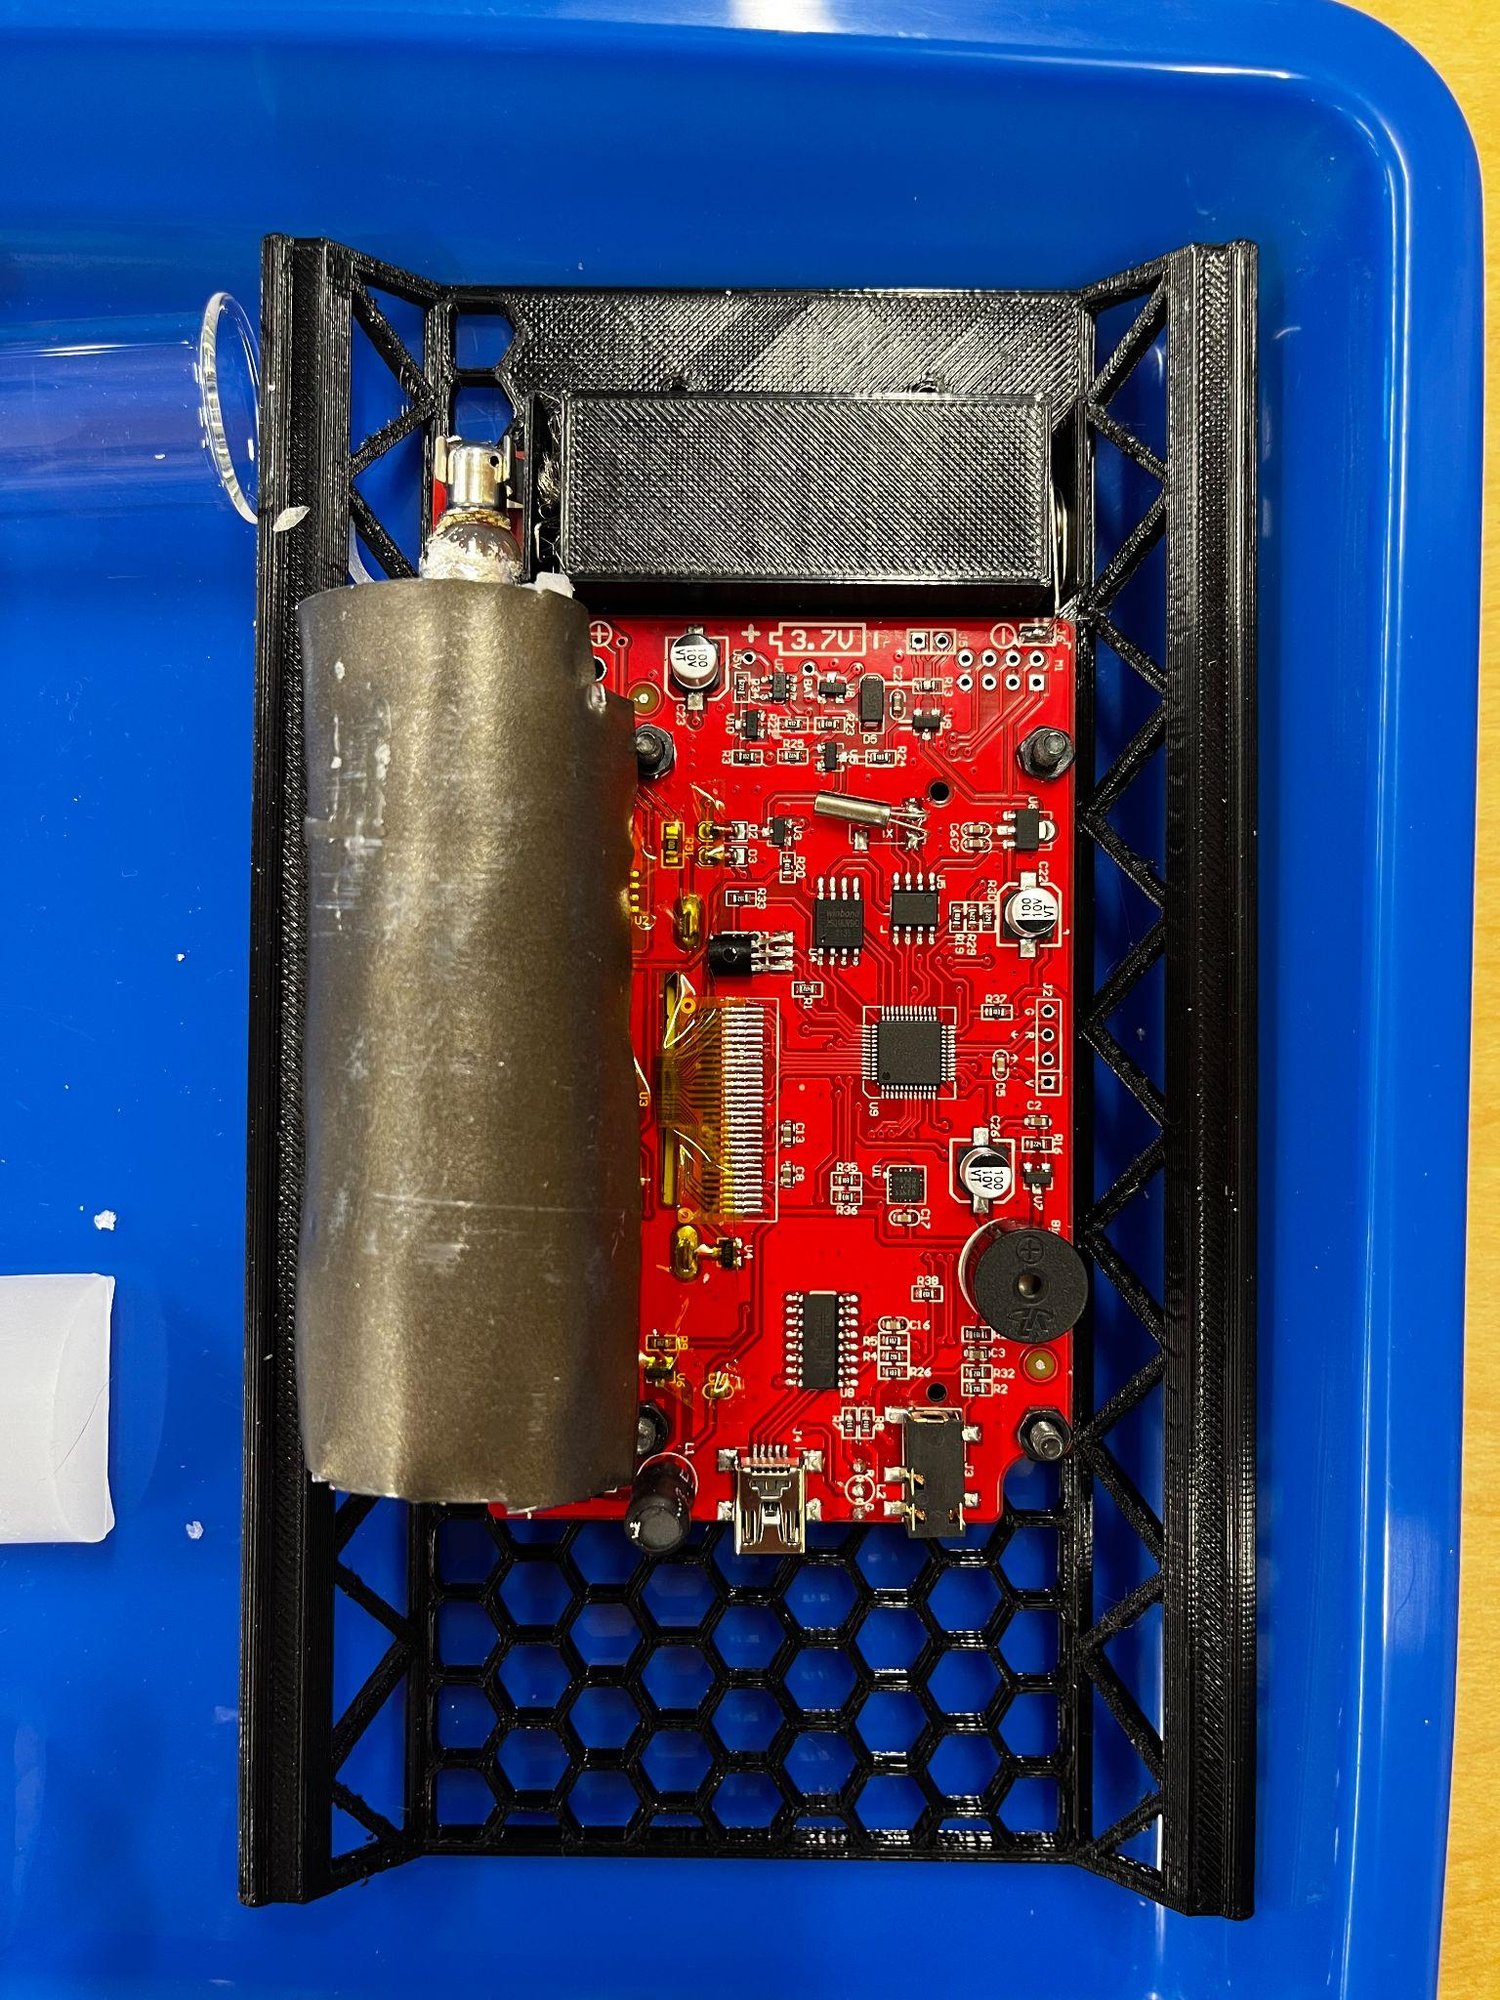
A mounted Geiger board shows the interface between an instrument and its carrier. Mechanical retention, connector access and sensor exposure belong in the same design review.
Inspect more hardware images →All starting values are illustrative, editable assumptions—not measured mission data. Set your own mass target and compare an ideal energy budget. This is a design exercise, not a flight-readiness or NASA compliance certification.
Example: 1,200 g of components against a 1,500 g target leaves 300 g. A nominal 7.4 V, 2,600 mAh pack with 70% usable energy supports a constant 4 W load for approximately 3.37 hours. Enable JavaScript to edit the example.
Define mission objectives, required sensors, success criteria, data products, and public-release boundaries.
Structure, mass, battery endurance, sensor mounting, insulation, camera retention, SD-card access.
Weather review, balloon fill, launch roles, APRS tracking, chase plan, recovery, and payload custody.
Unit consistency, source labels, workbook reconciliation, plots, gallery, and mission report.
| Subsystem | Purpose | Evidence |
|---|---|---|
| Structure | Protect avionics and sensors during ascent, descent, and recovery. | Mass budget, CAD, photos, drop/fit checks. |
| Power | Keep sensors, GPS, camera, and logger alive in cold conditions. | Battery chemistry, current budget, cold test. |
| Telemetry | Track flight path and support recovery. | APRS export, timestamps, coordinates. |
| Science sensors | Measure particulate, CO2, temperature, humidity, and count rate. | Datasheets, calibration notes, raw workbooks. |
| Recovery | Preserve payload and data integrity after landing. | Landing photos, custody notes, card image. |
The revised body was approximately 20% lighter and returned with minimal damage.
A single battery system powered the Arduino, sensor suite, and two RunCam Thumb 2 cameras.
Recovery procedures were formalized after prior missions exposed preventable data-loss risks.
Git-based versioning and clearer documentation made software changes traceable across the team.
Keep the original figure's source, period, axes and units together. Reported instrument response is not automatically a calibrated environmental measurement. Counts per minute are not radiation dose without an instrument-specific calibration. Preserve particle units as printed and flag unit ambiguity rather than silently converting them.