
Built here. Flown above Arizona.
Inside the
payload.
Carbon-fiber structure. Printed instrument carriers. Electronics that have to fit, connect, and keep recording.
Explore the team’s hardware photographs and design figures, then follow the onboard camera into the Spring 2026 flight.
- 01
- Structure
- 02
- Electronics
- 03
- Flight
The visual record
From CAD to camera frame.
Photos, design views, and flight stills are labeled separately. Open any image for an uncropped view.
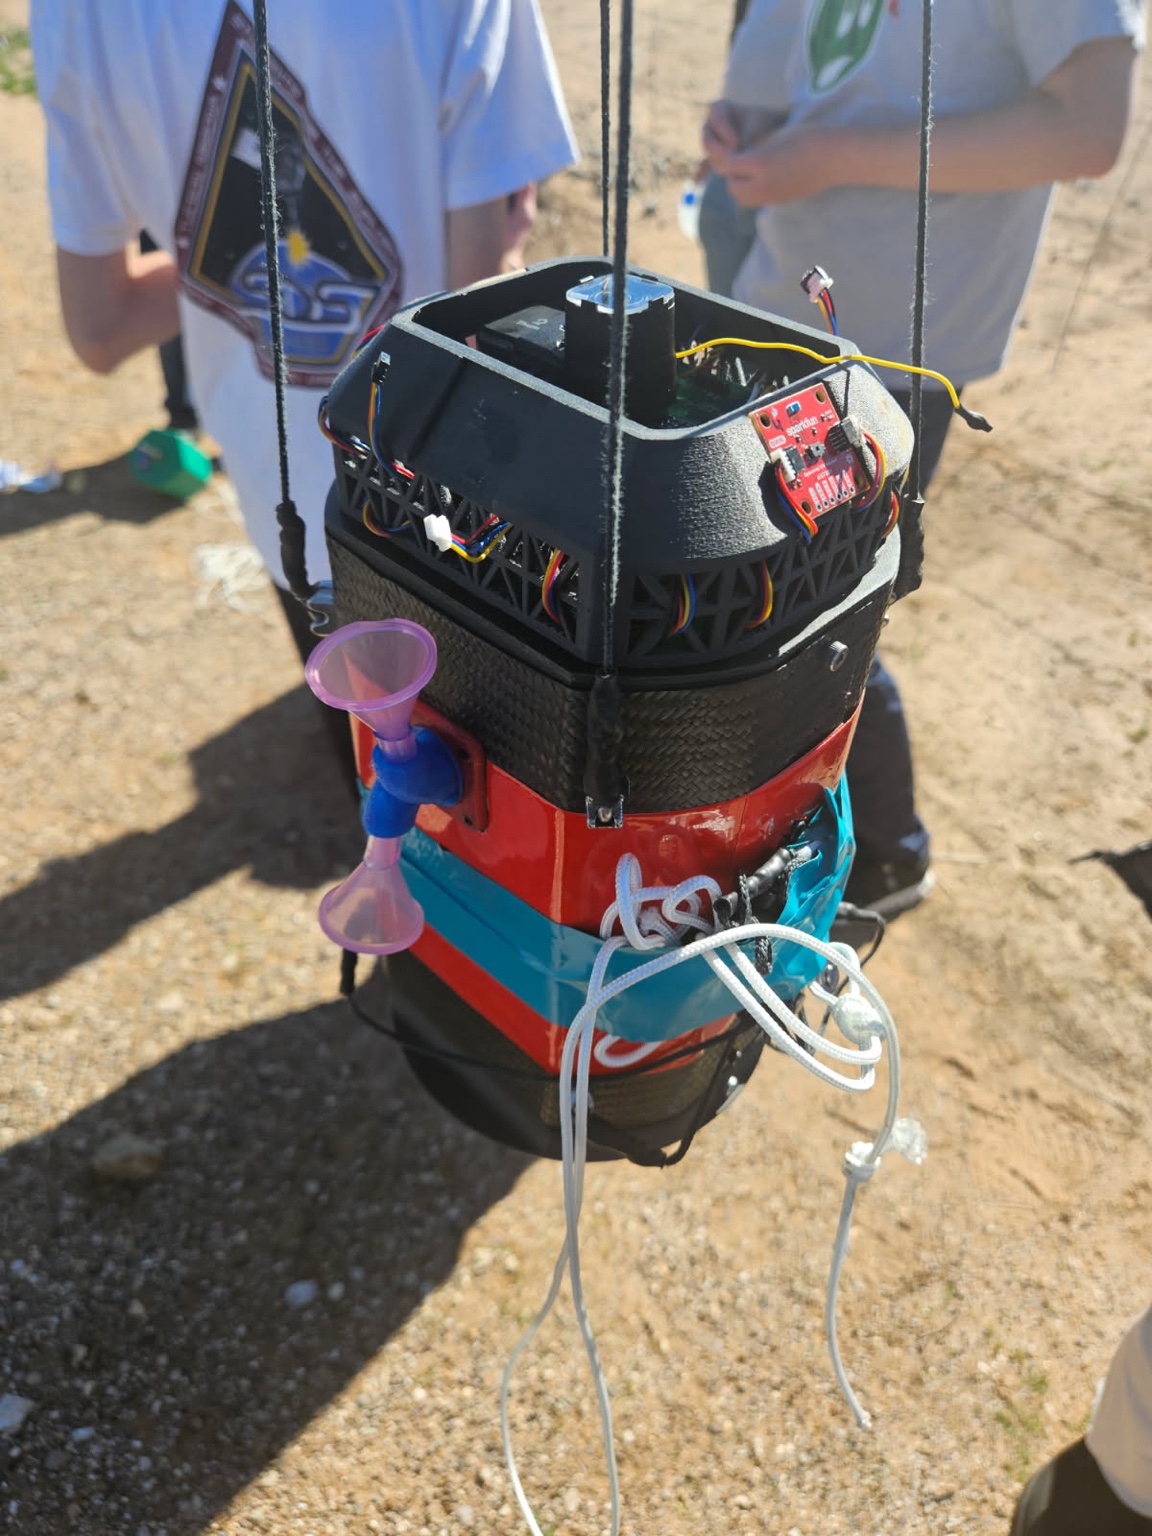
Integrated payload
An external board, routed cables, openings, and suspension lines share the assembled body. This view connects the individual subsystems to their physical installation.
2025 mission record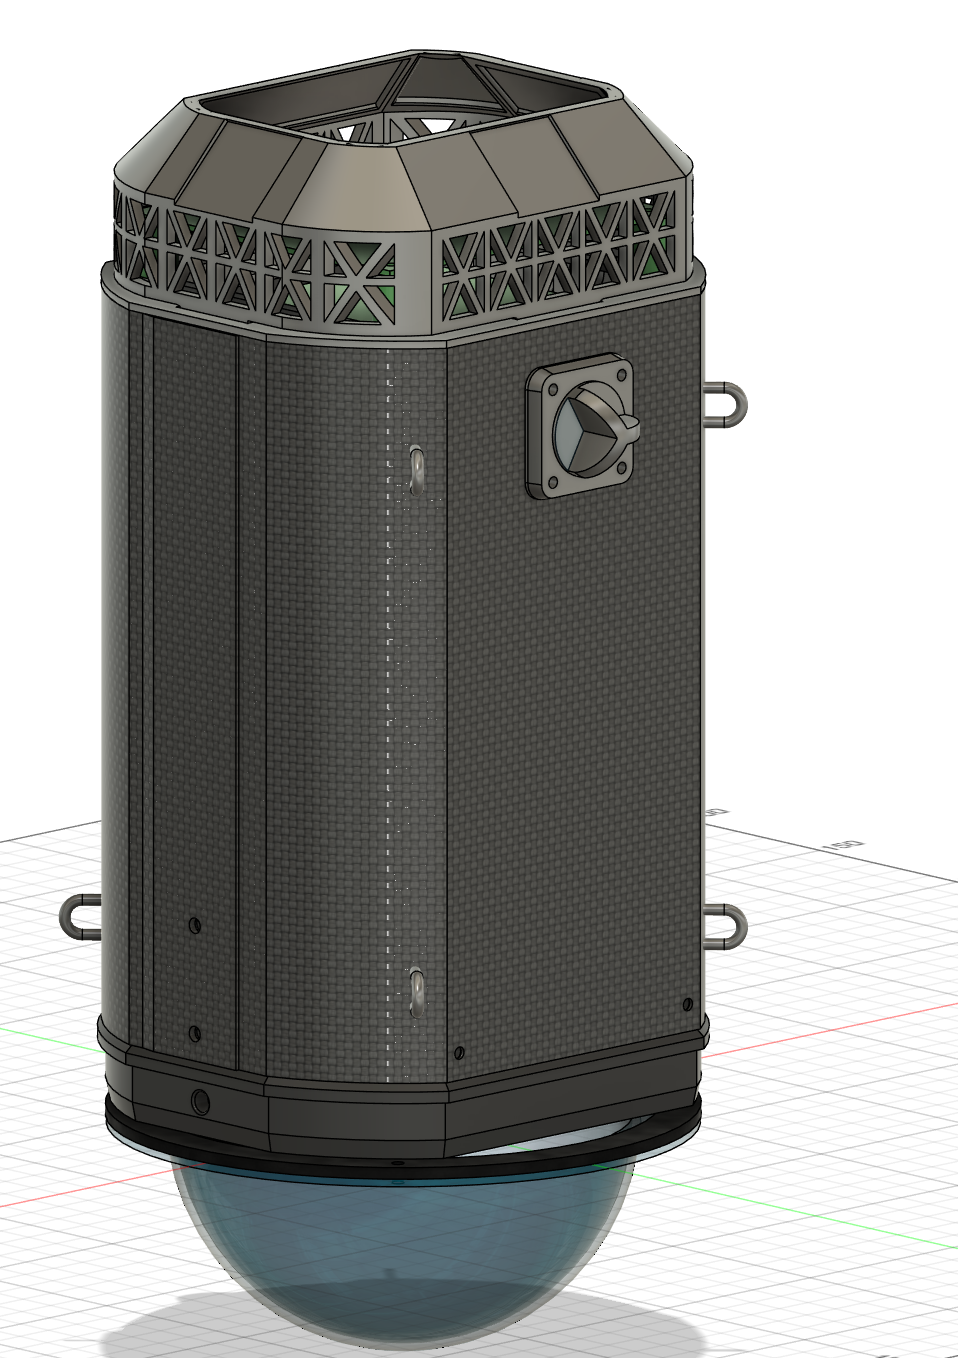
Body, openings, and attachment points
The design view separates the outer shell, open lattice section, and lower dome. Look at how access openings and attachment points interrupt the otherwise continuous body.
Fall 2025 engineering record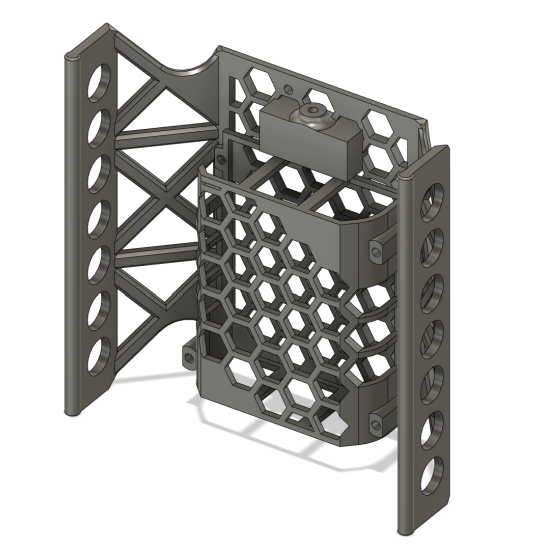
Geometry for an instrument carrier
Honeycomb cutouts, braced rails, and mounting holes define the carrier. Compare this geometry with the printed holder in the electronics photographs.
Explore payload engineering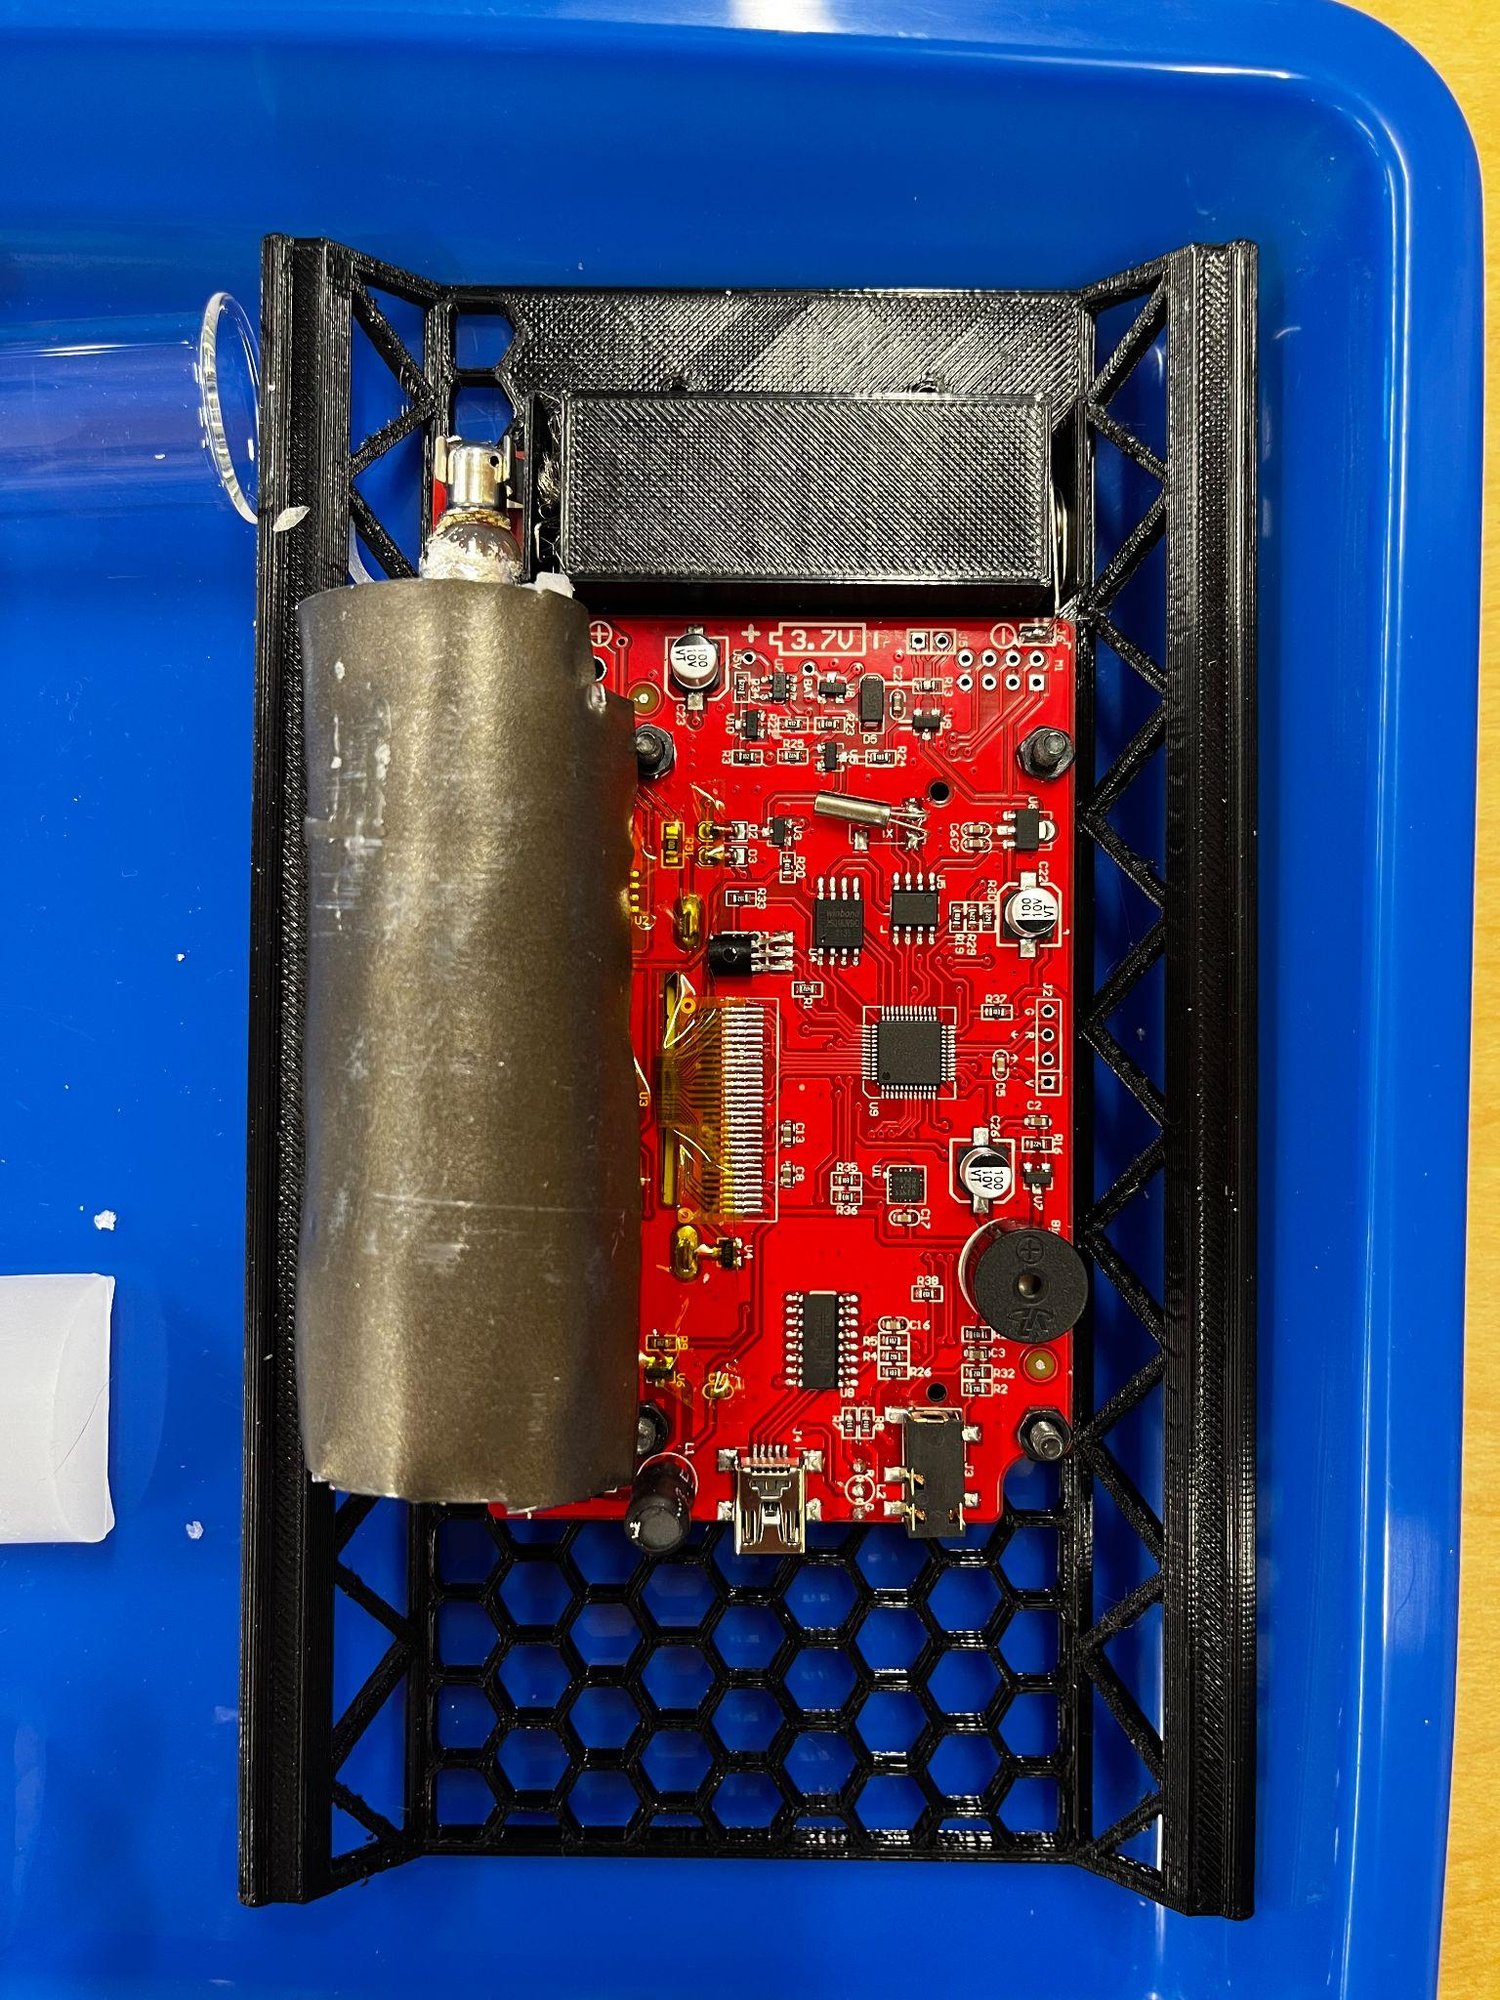
The board inside the carrier
The detector assembly and populated circuit board sit within the printed support. Connectors, fasteners, and component clearance make the mechanical–electrical interface visible.
Fall 2025 engineering record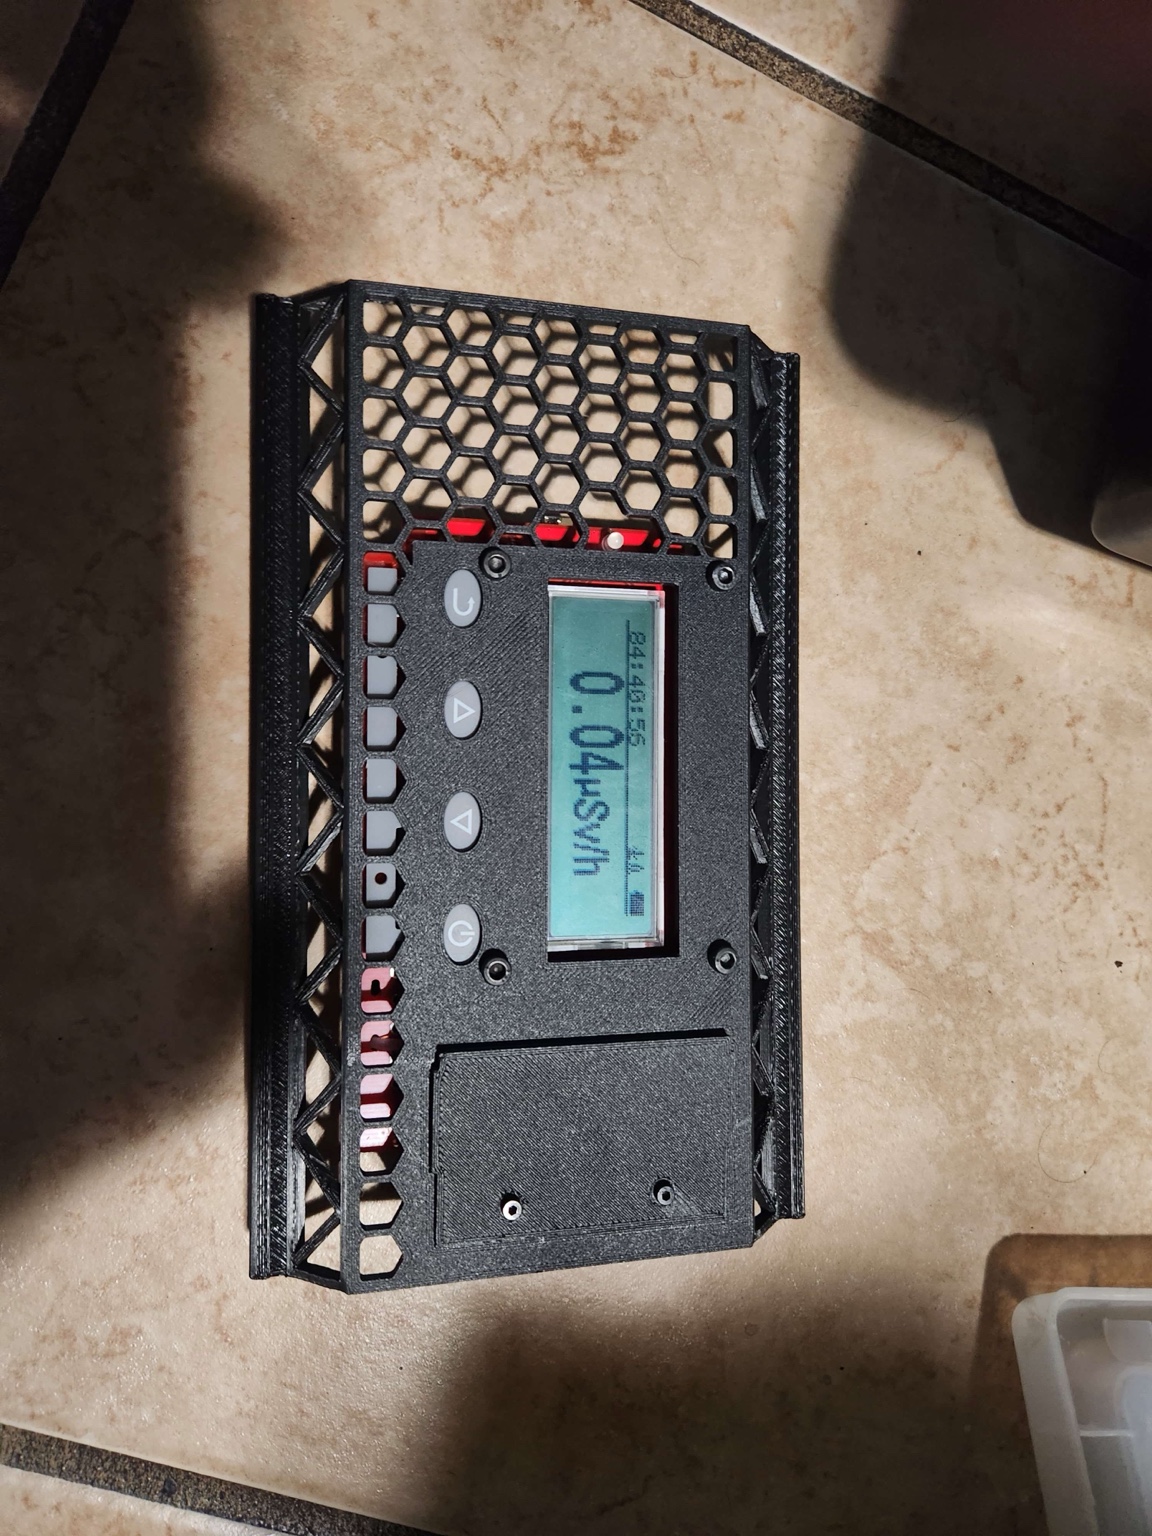
A serviceable detector holder
The display, controls, and battery cover remain accessible inside the carrier. This is a hardware photograph; the visible display is not a flight measurement series.
Explore the instrument interfaces
Position, motion, pressure, and logging
A component-reference montage brings the GPS, orientation, pressure/temperature, storage, and UV boards together. It is a reference figure, not a photograph of an assembled flight PCB.
Read the subsystem record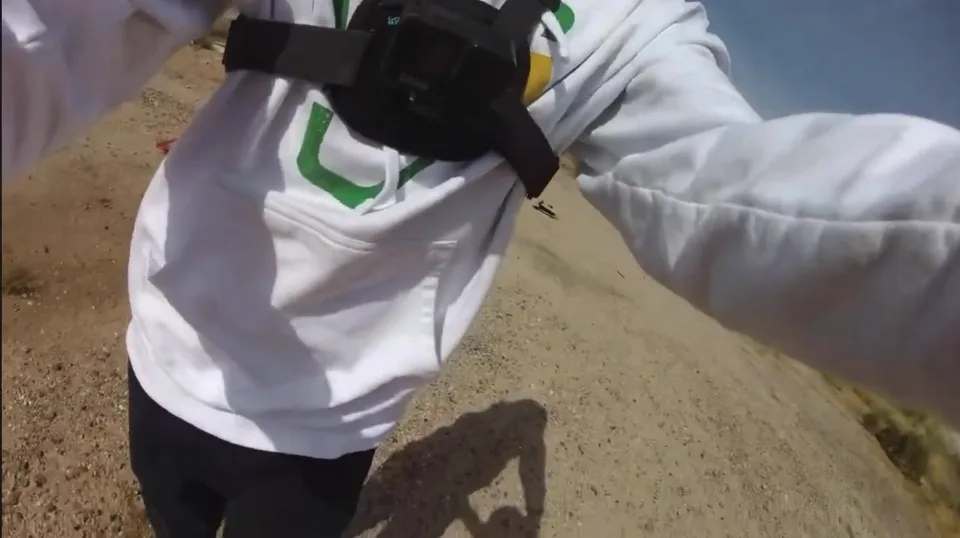
At the launch site
The launch clip begins close to the ground, with the team handling the payload. This still preserves the camera’s viewpoint before the ascent.
Watch the source flight clips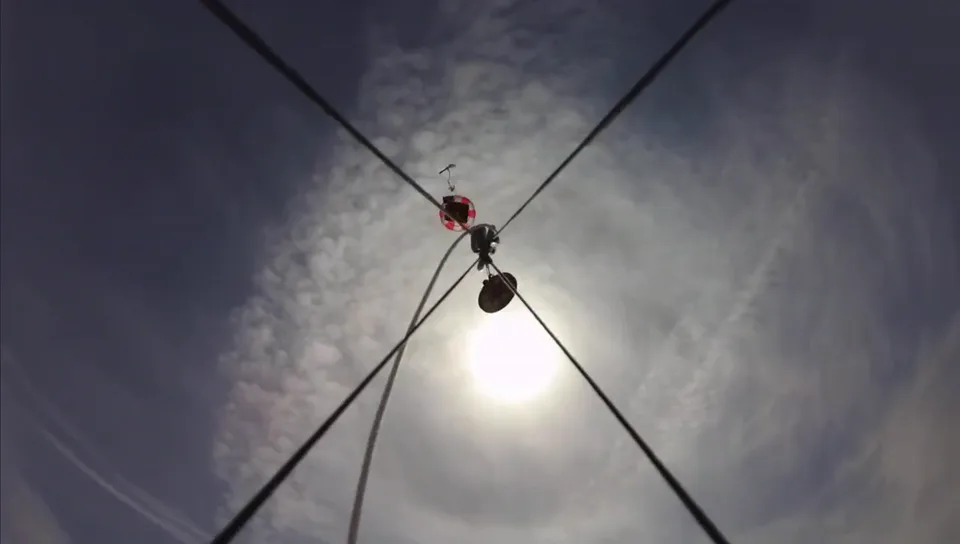
Looking up the flight train
Suspension lines converge above the camera. The ascent sequence gives a direct view of how the hanging equipment moves together in flight.
Watch the source flight clips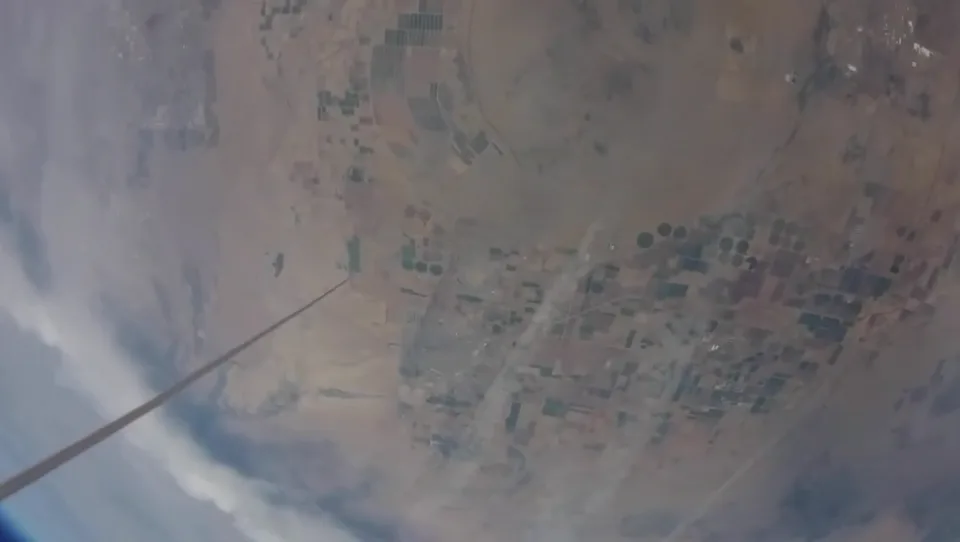
Terrain from aloft
Field boundaries and circular irrigation patterns become visible from above. The tilted frame preserves the recorded camera orientation.
Watch the source flight clips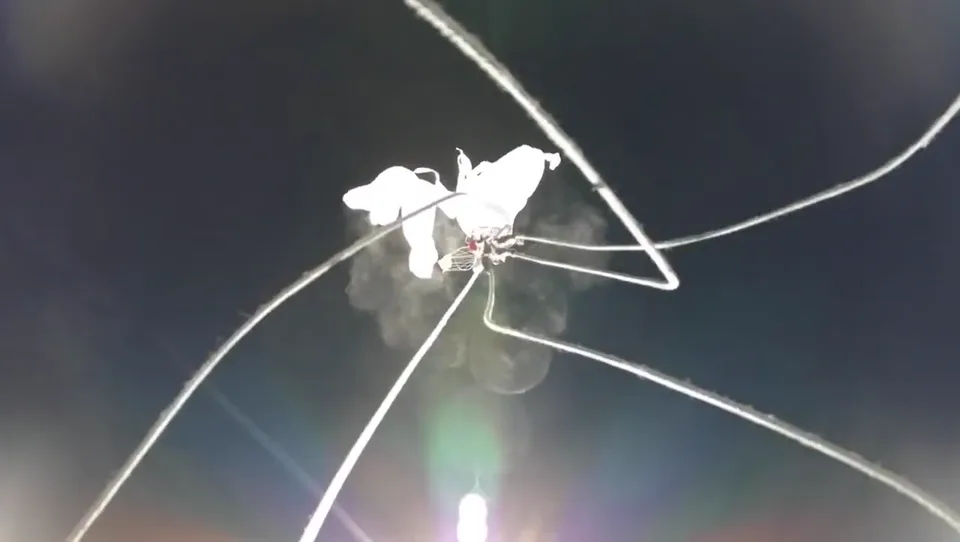
The burst sequence
White balloon material and the flight lines cross the onboard view. Watch the clip to see the transition unfold over time.
Watch the source flight clipsKeep exploring
The image is the starting point.
Compare the hardware with the team’s engineering record, or place the flight footage alongside the recorded trajectory.
The source boards / research presentation
From the display to the record.
Cropped board photographs keep the presentation readable. For complete graph axes and larger figures, open the corresponding semester research page.
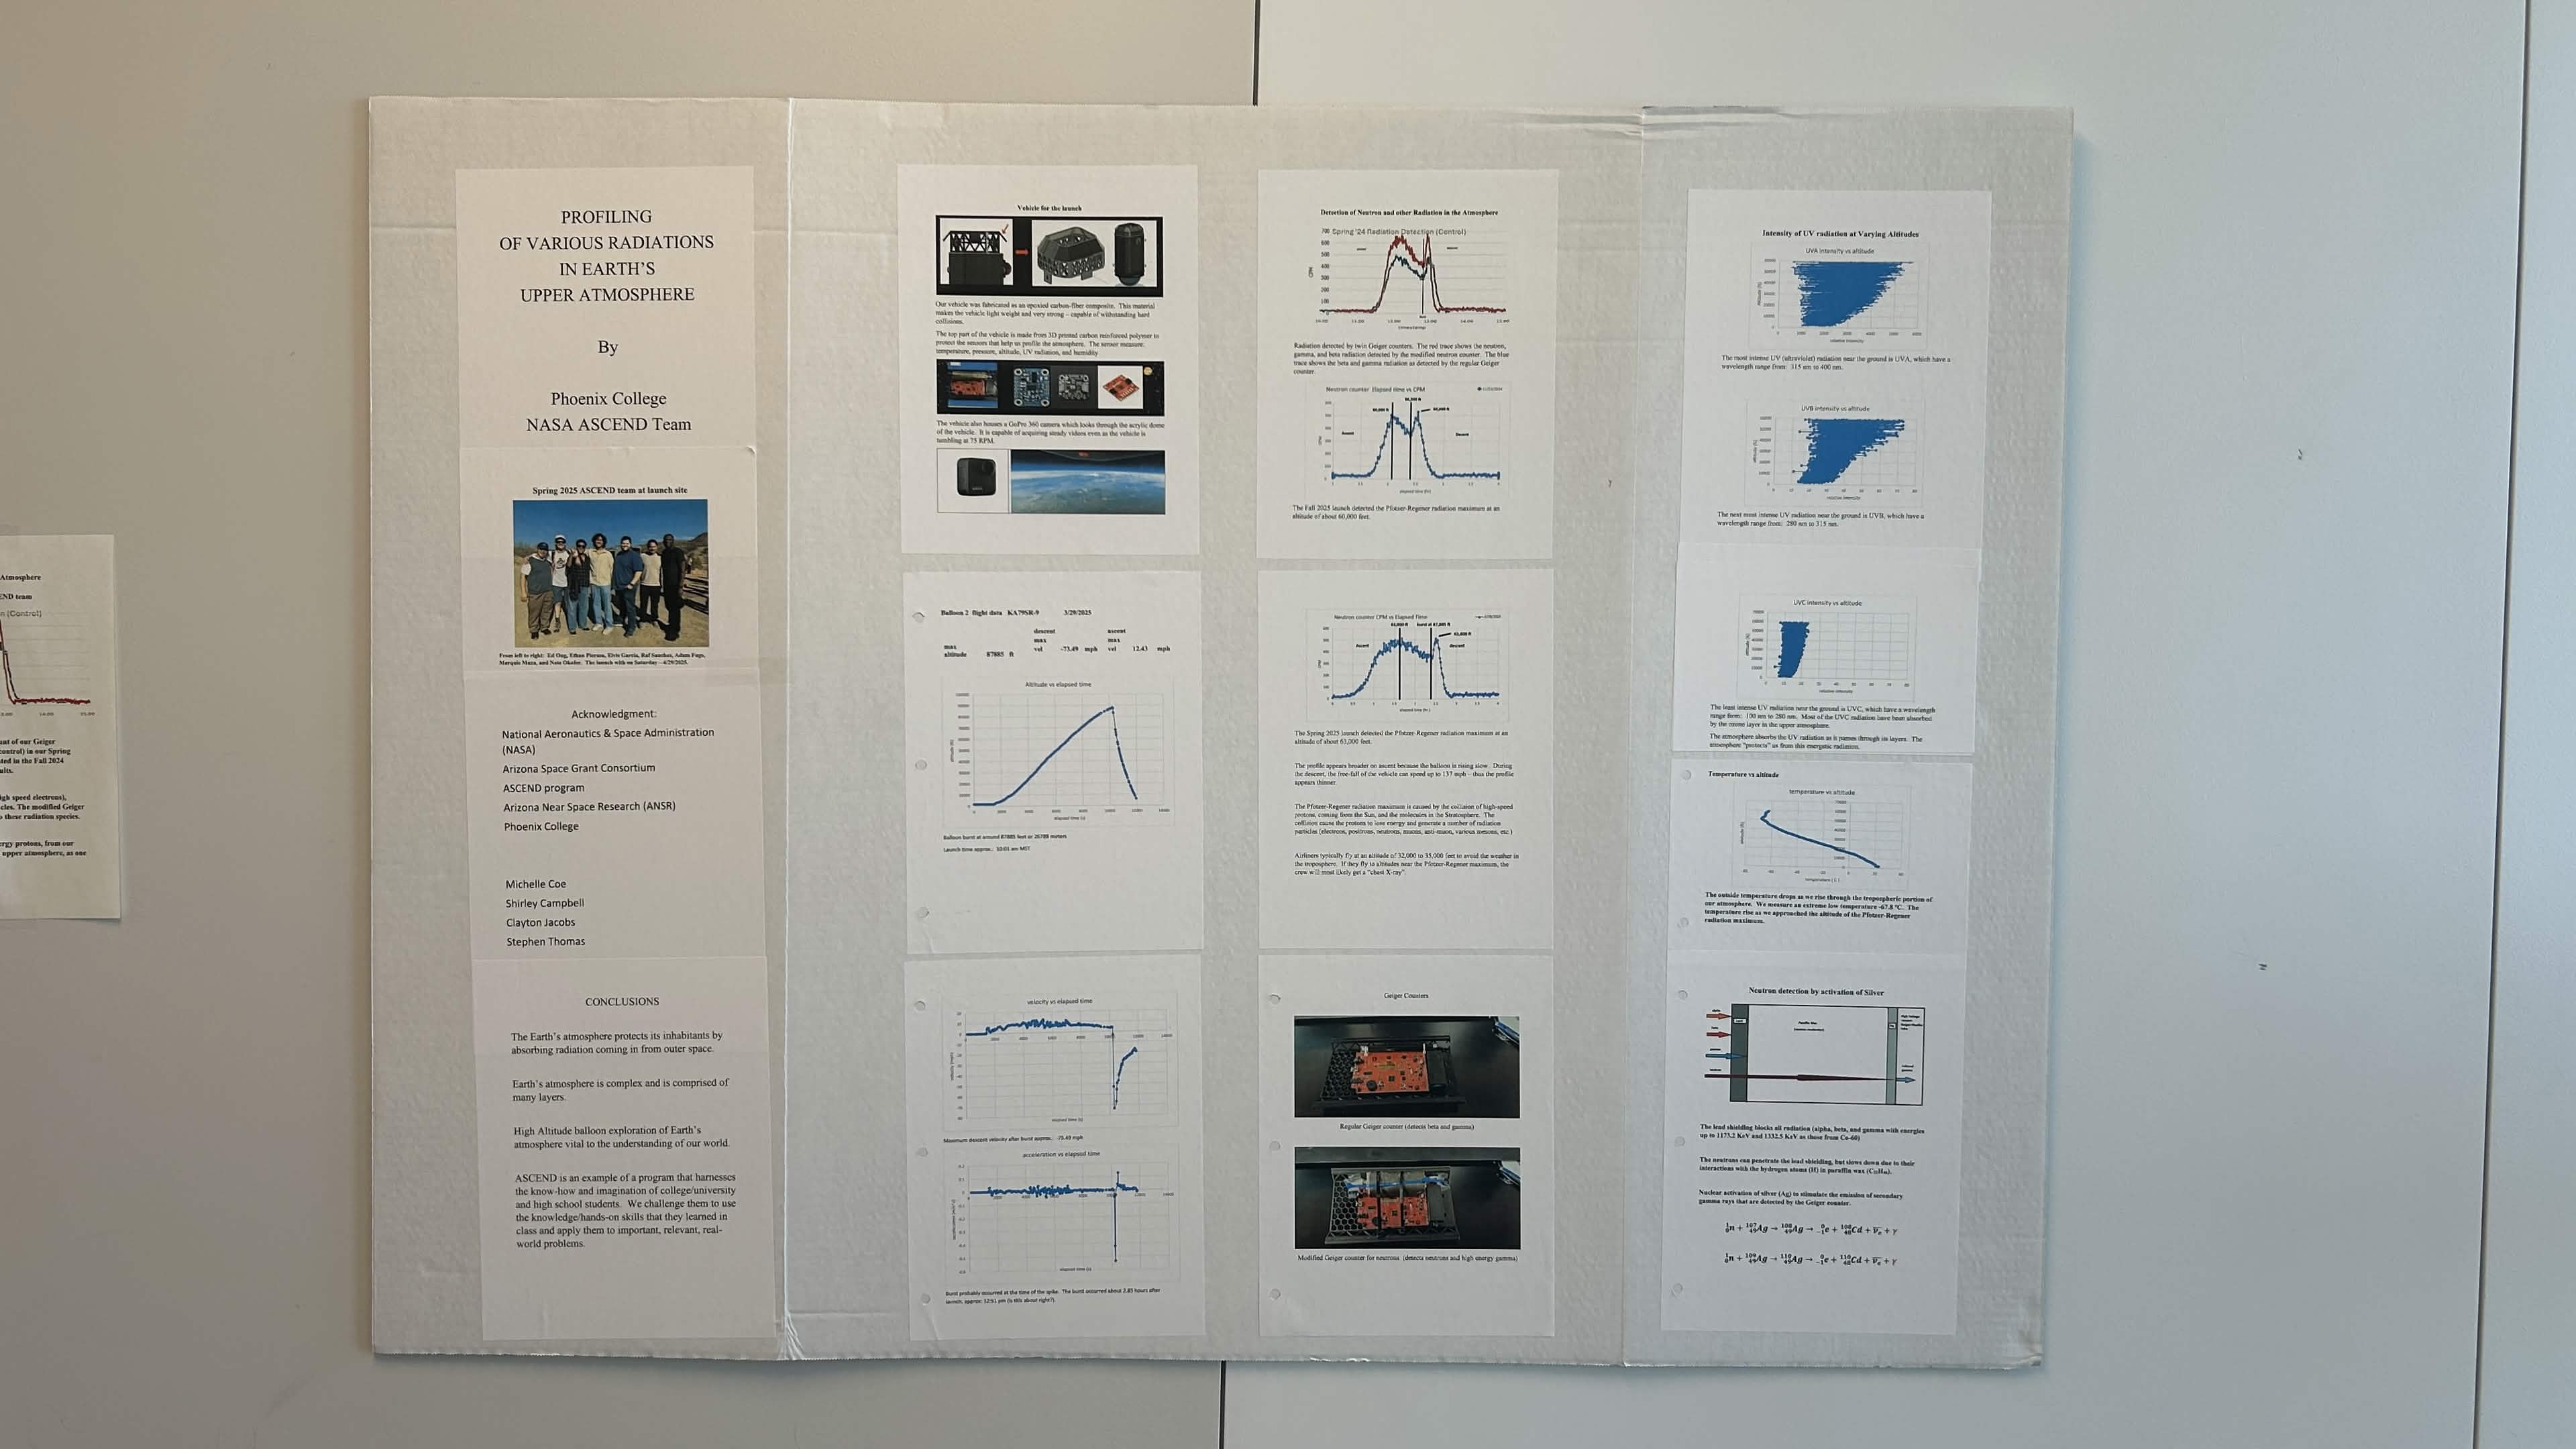
Spring 2025
Spring 2025 research display
The full research display, bounded to the board. The dated November 2024 plot reproduced here belongs to Fall 2024, not the Spring 2025 flight.
Open related research record →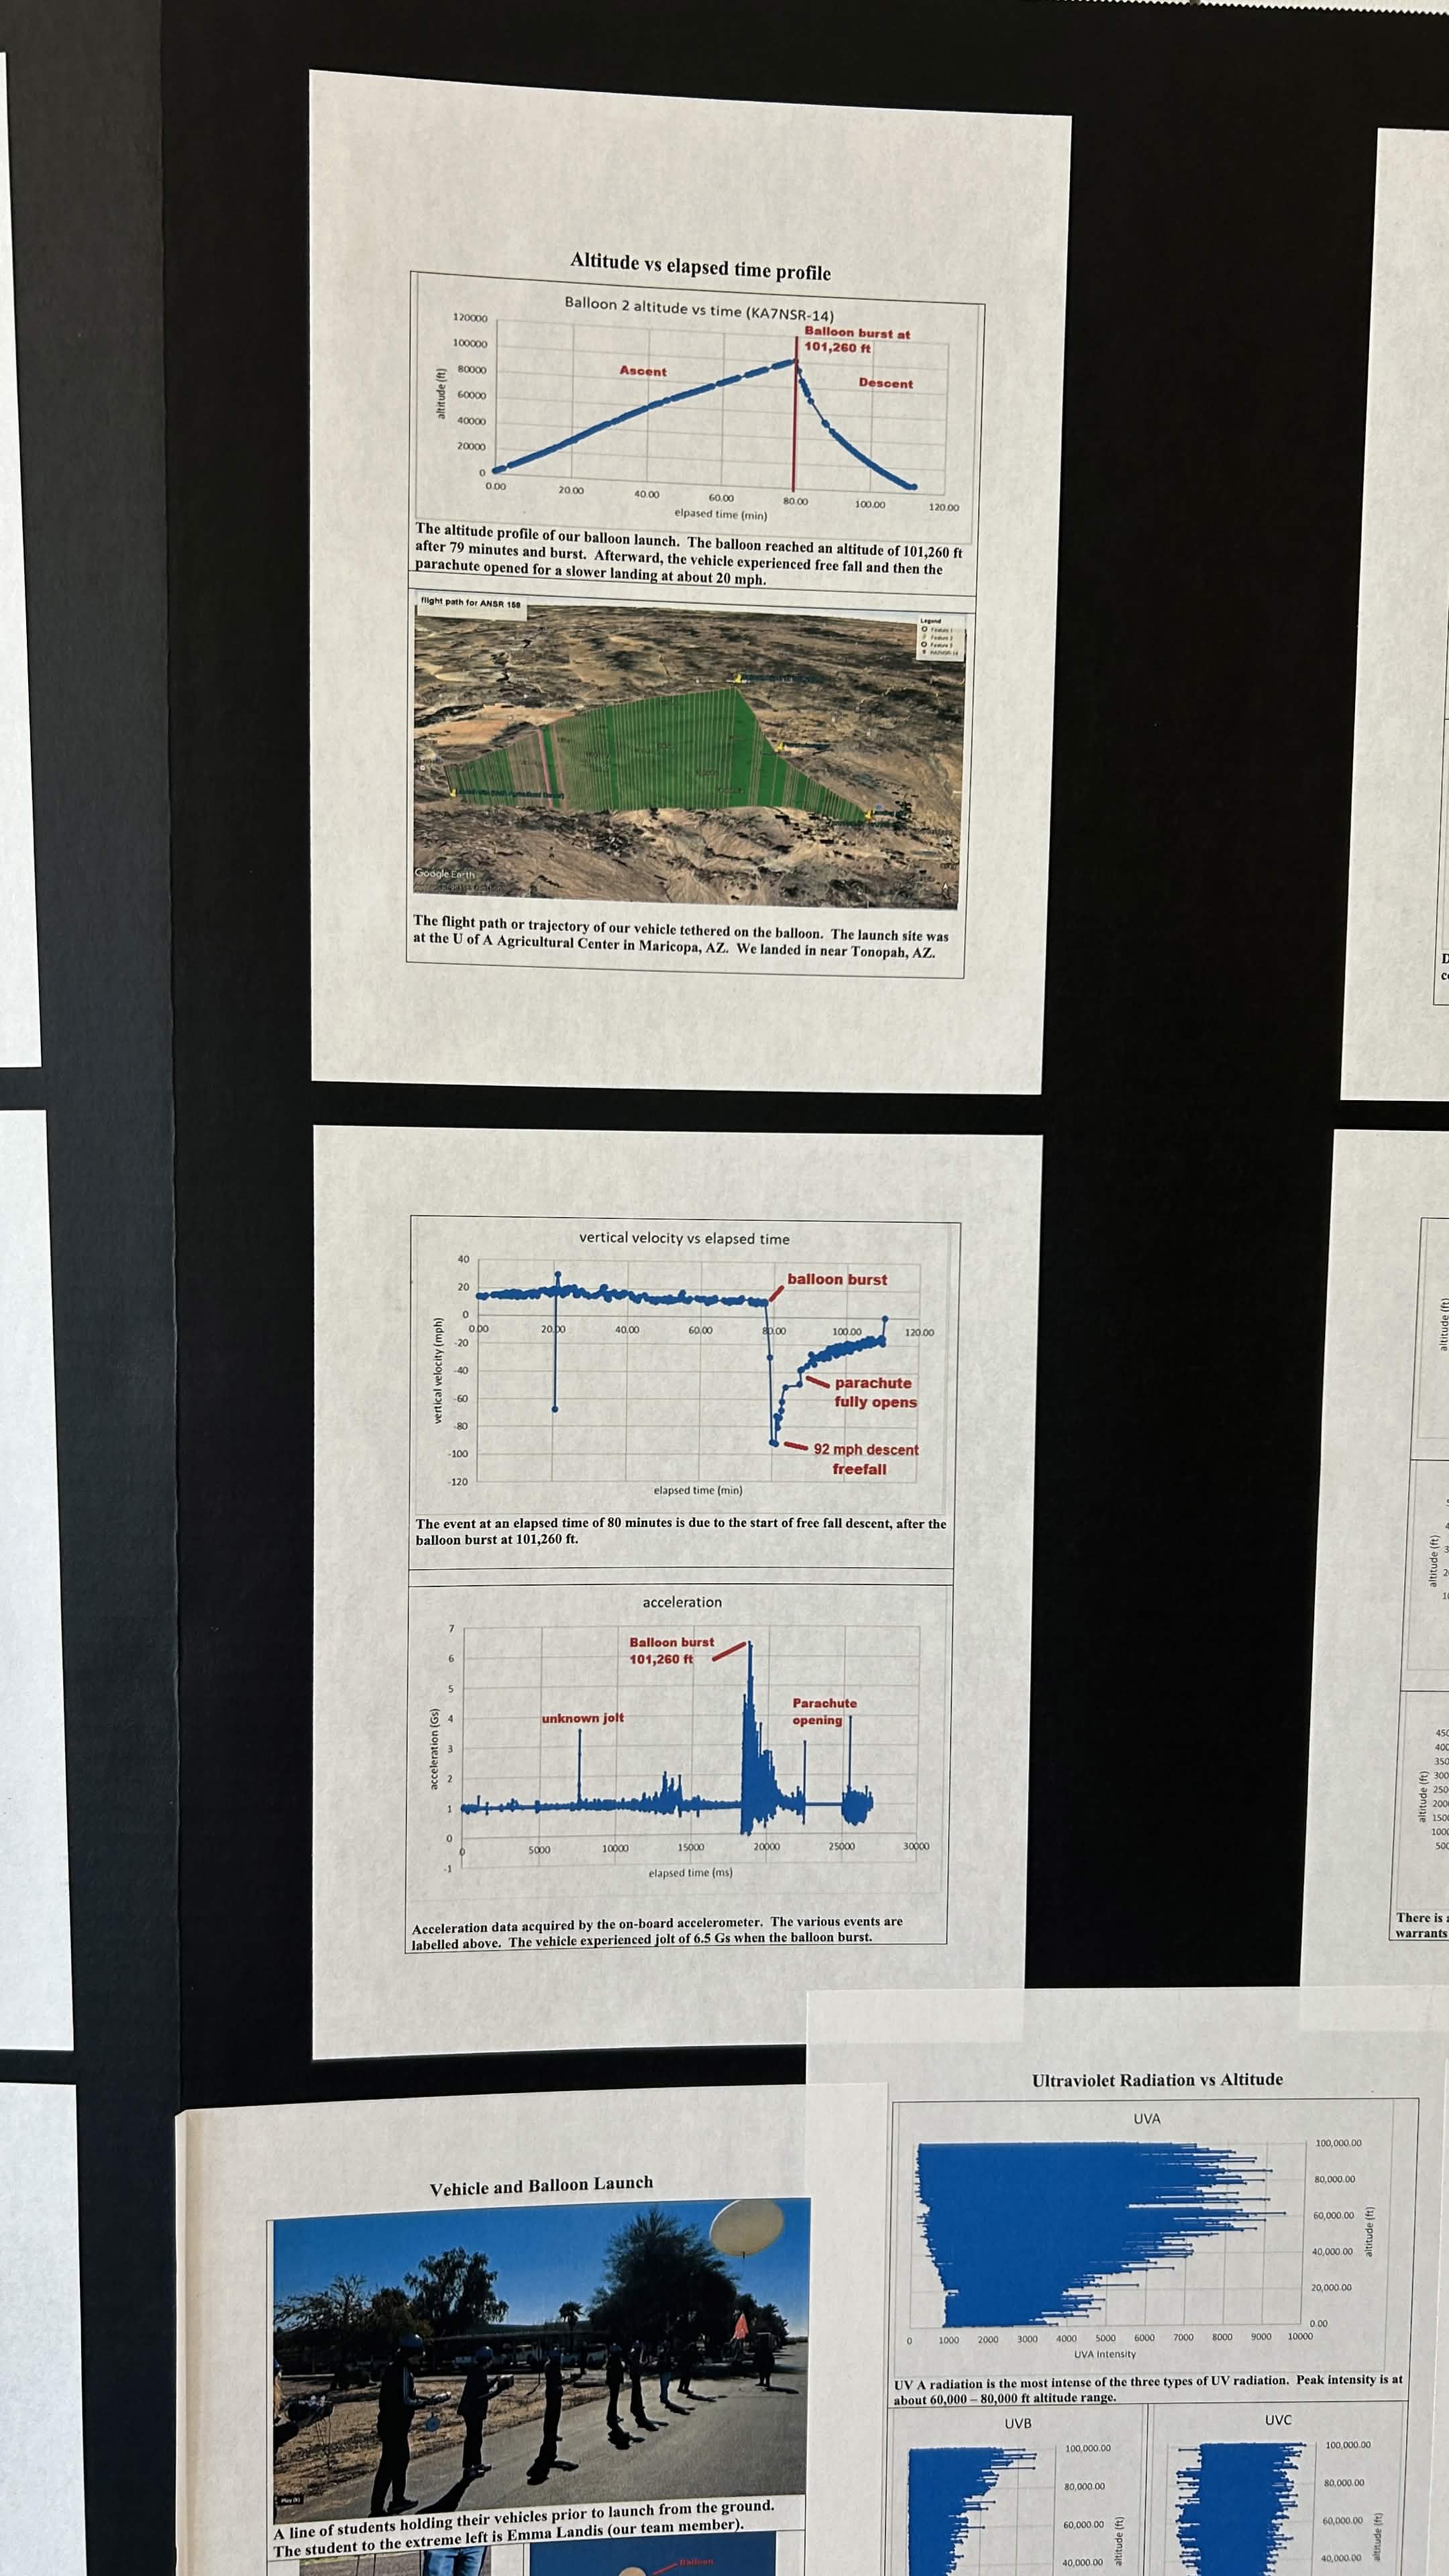
Fall 2025
Fall 2025 flight dynamics
The flight profile, trajectory and acceleration sheets. The poster labels 101,260 ft and approximately 92 mph descent; the source report’s differing values remain disclosed.
Open related research record →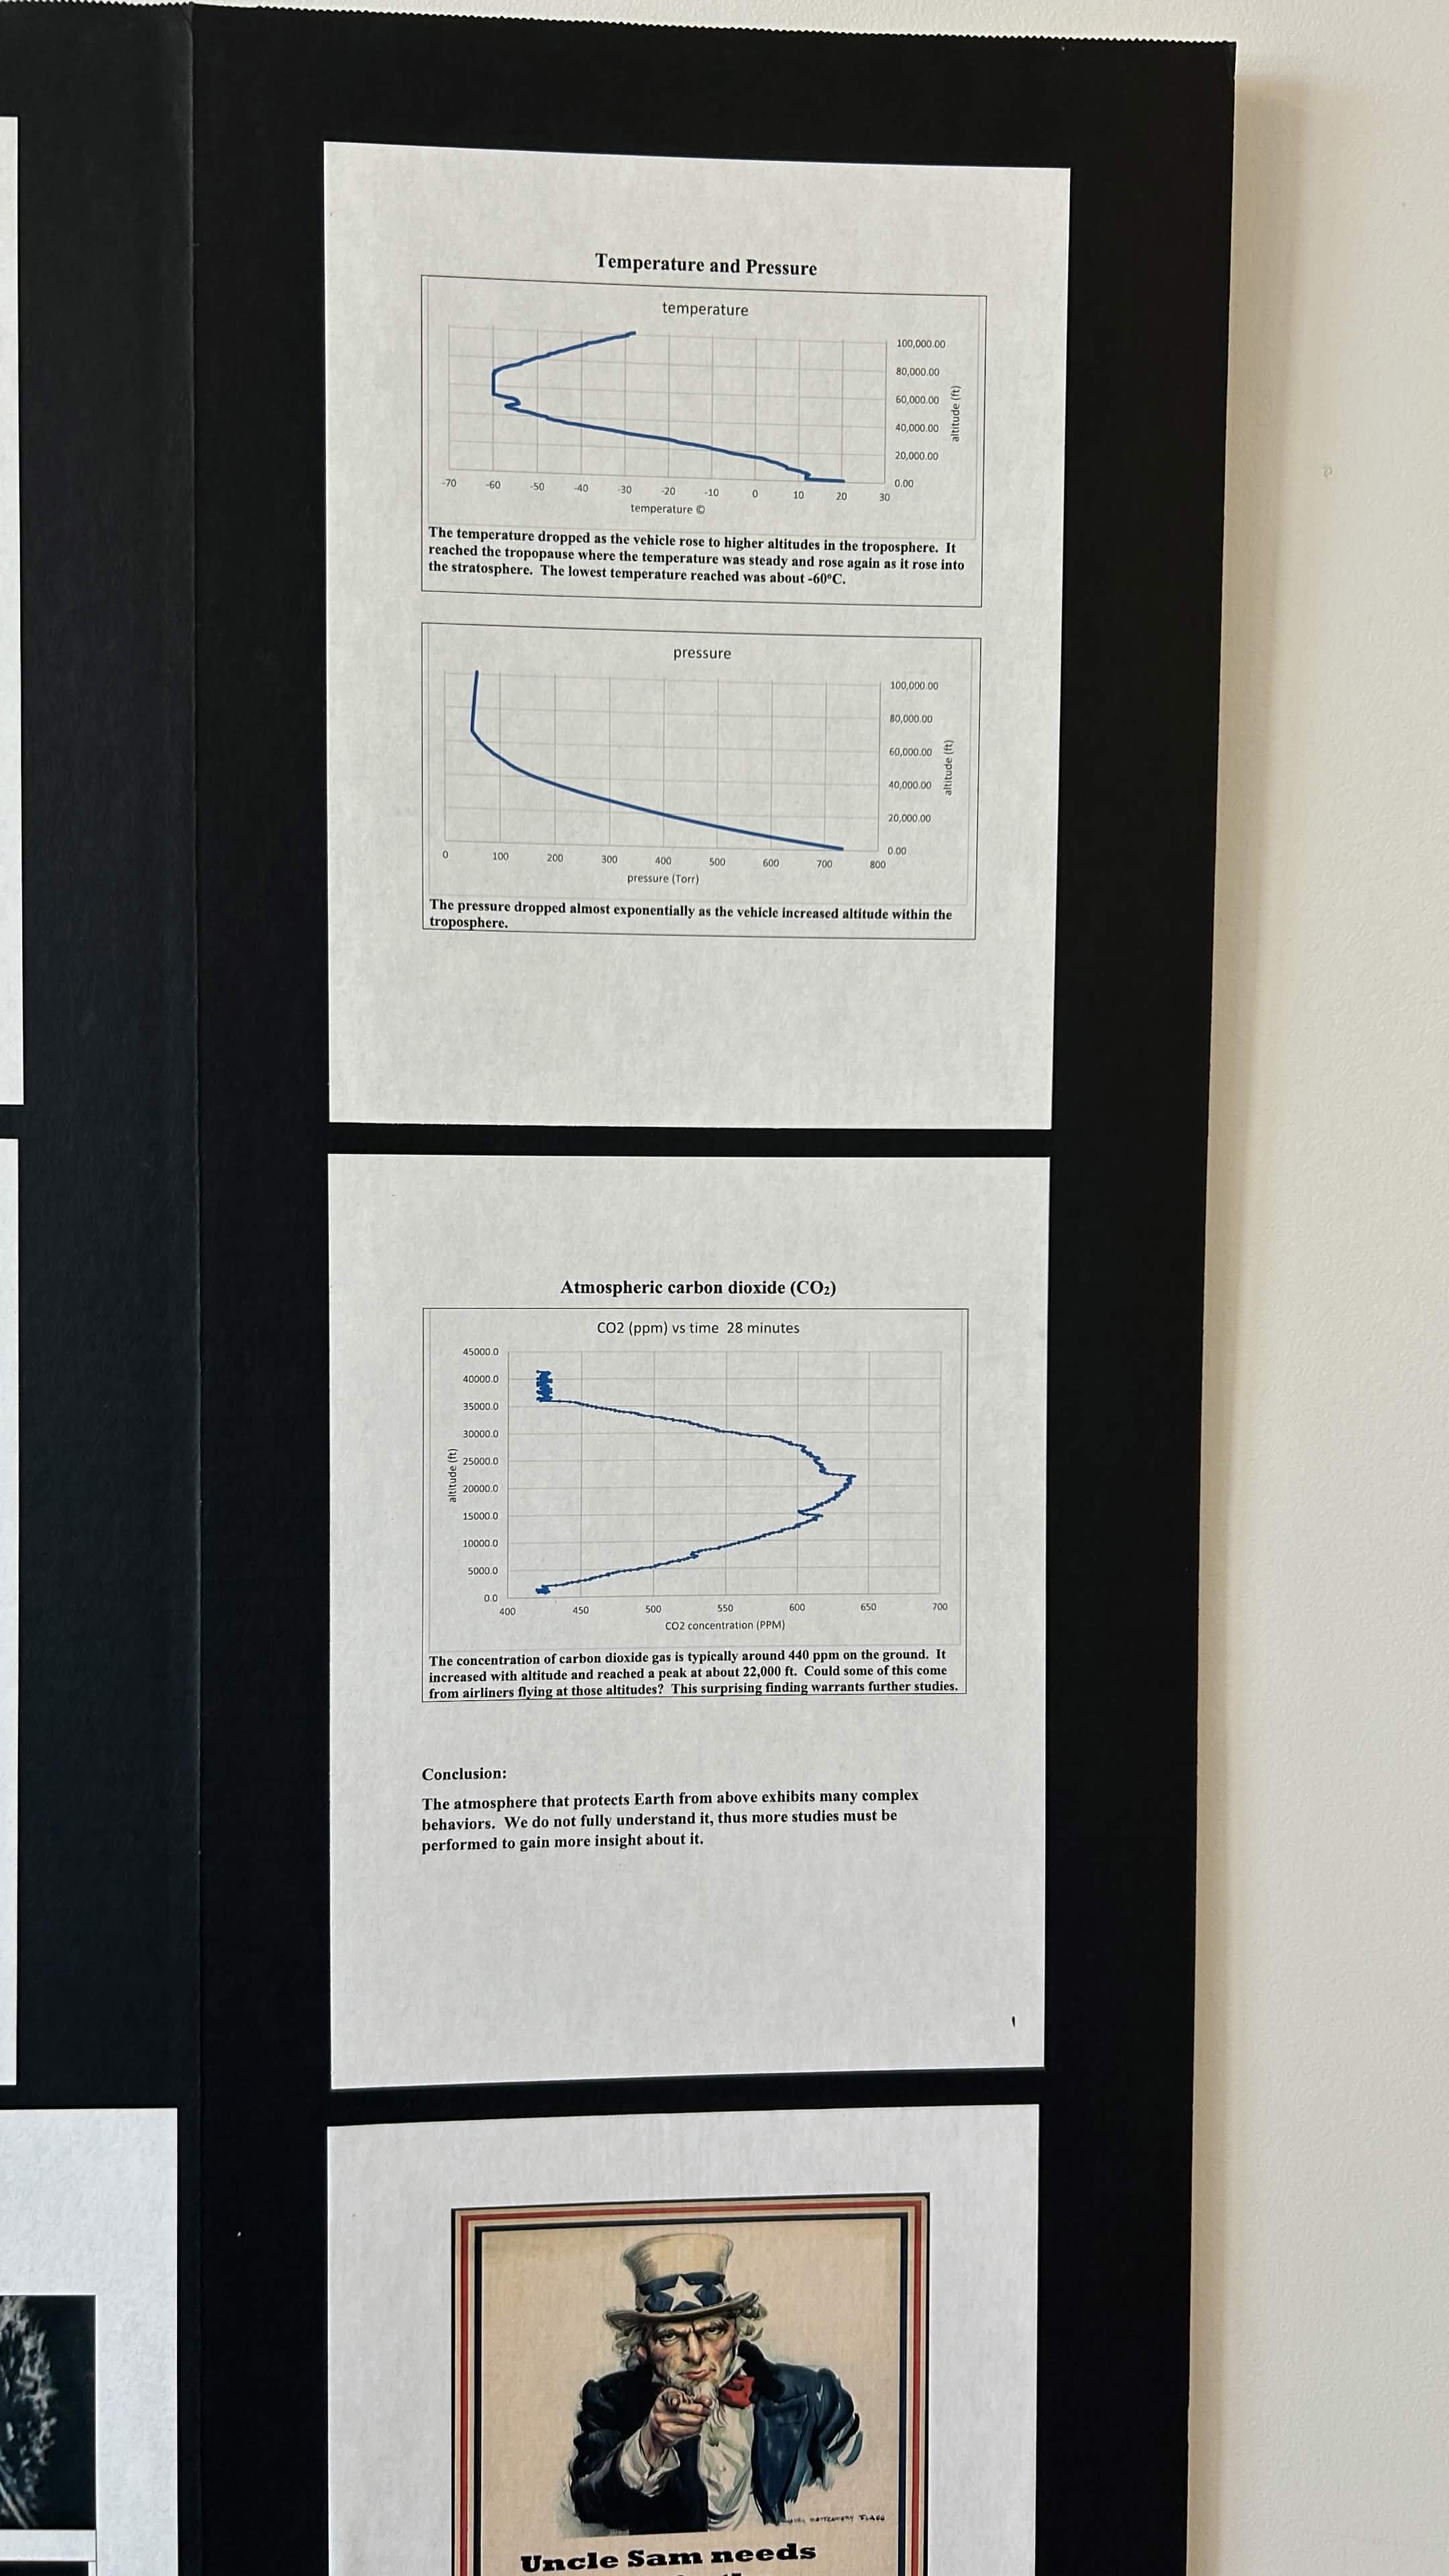
Fall 2025
Fall 2025 atmospheric channels
Temperature, pressure and CO₂ presentation sheets. CO₂ covers only the lower recorded ascent, not the full flight. The proposed cause in the board text is not treated as established.
Open related research record →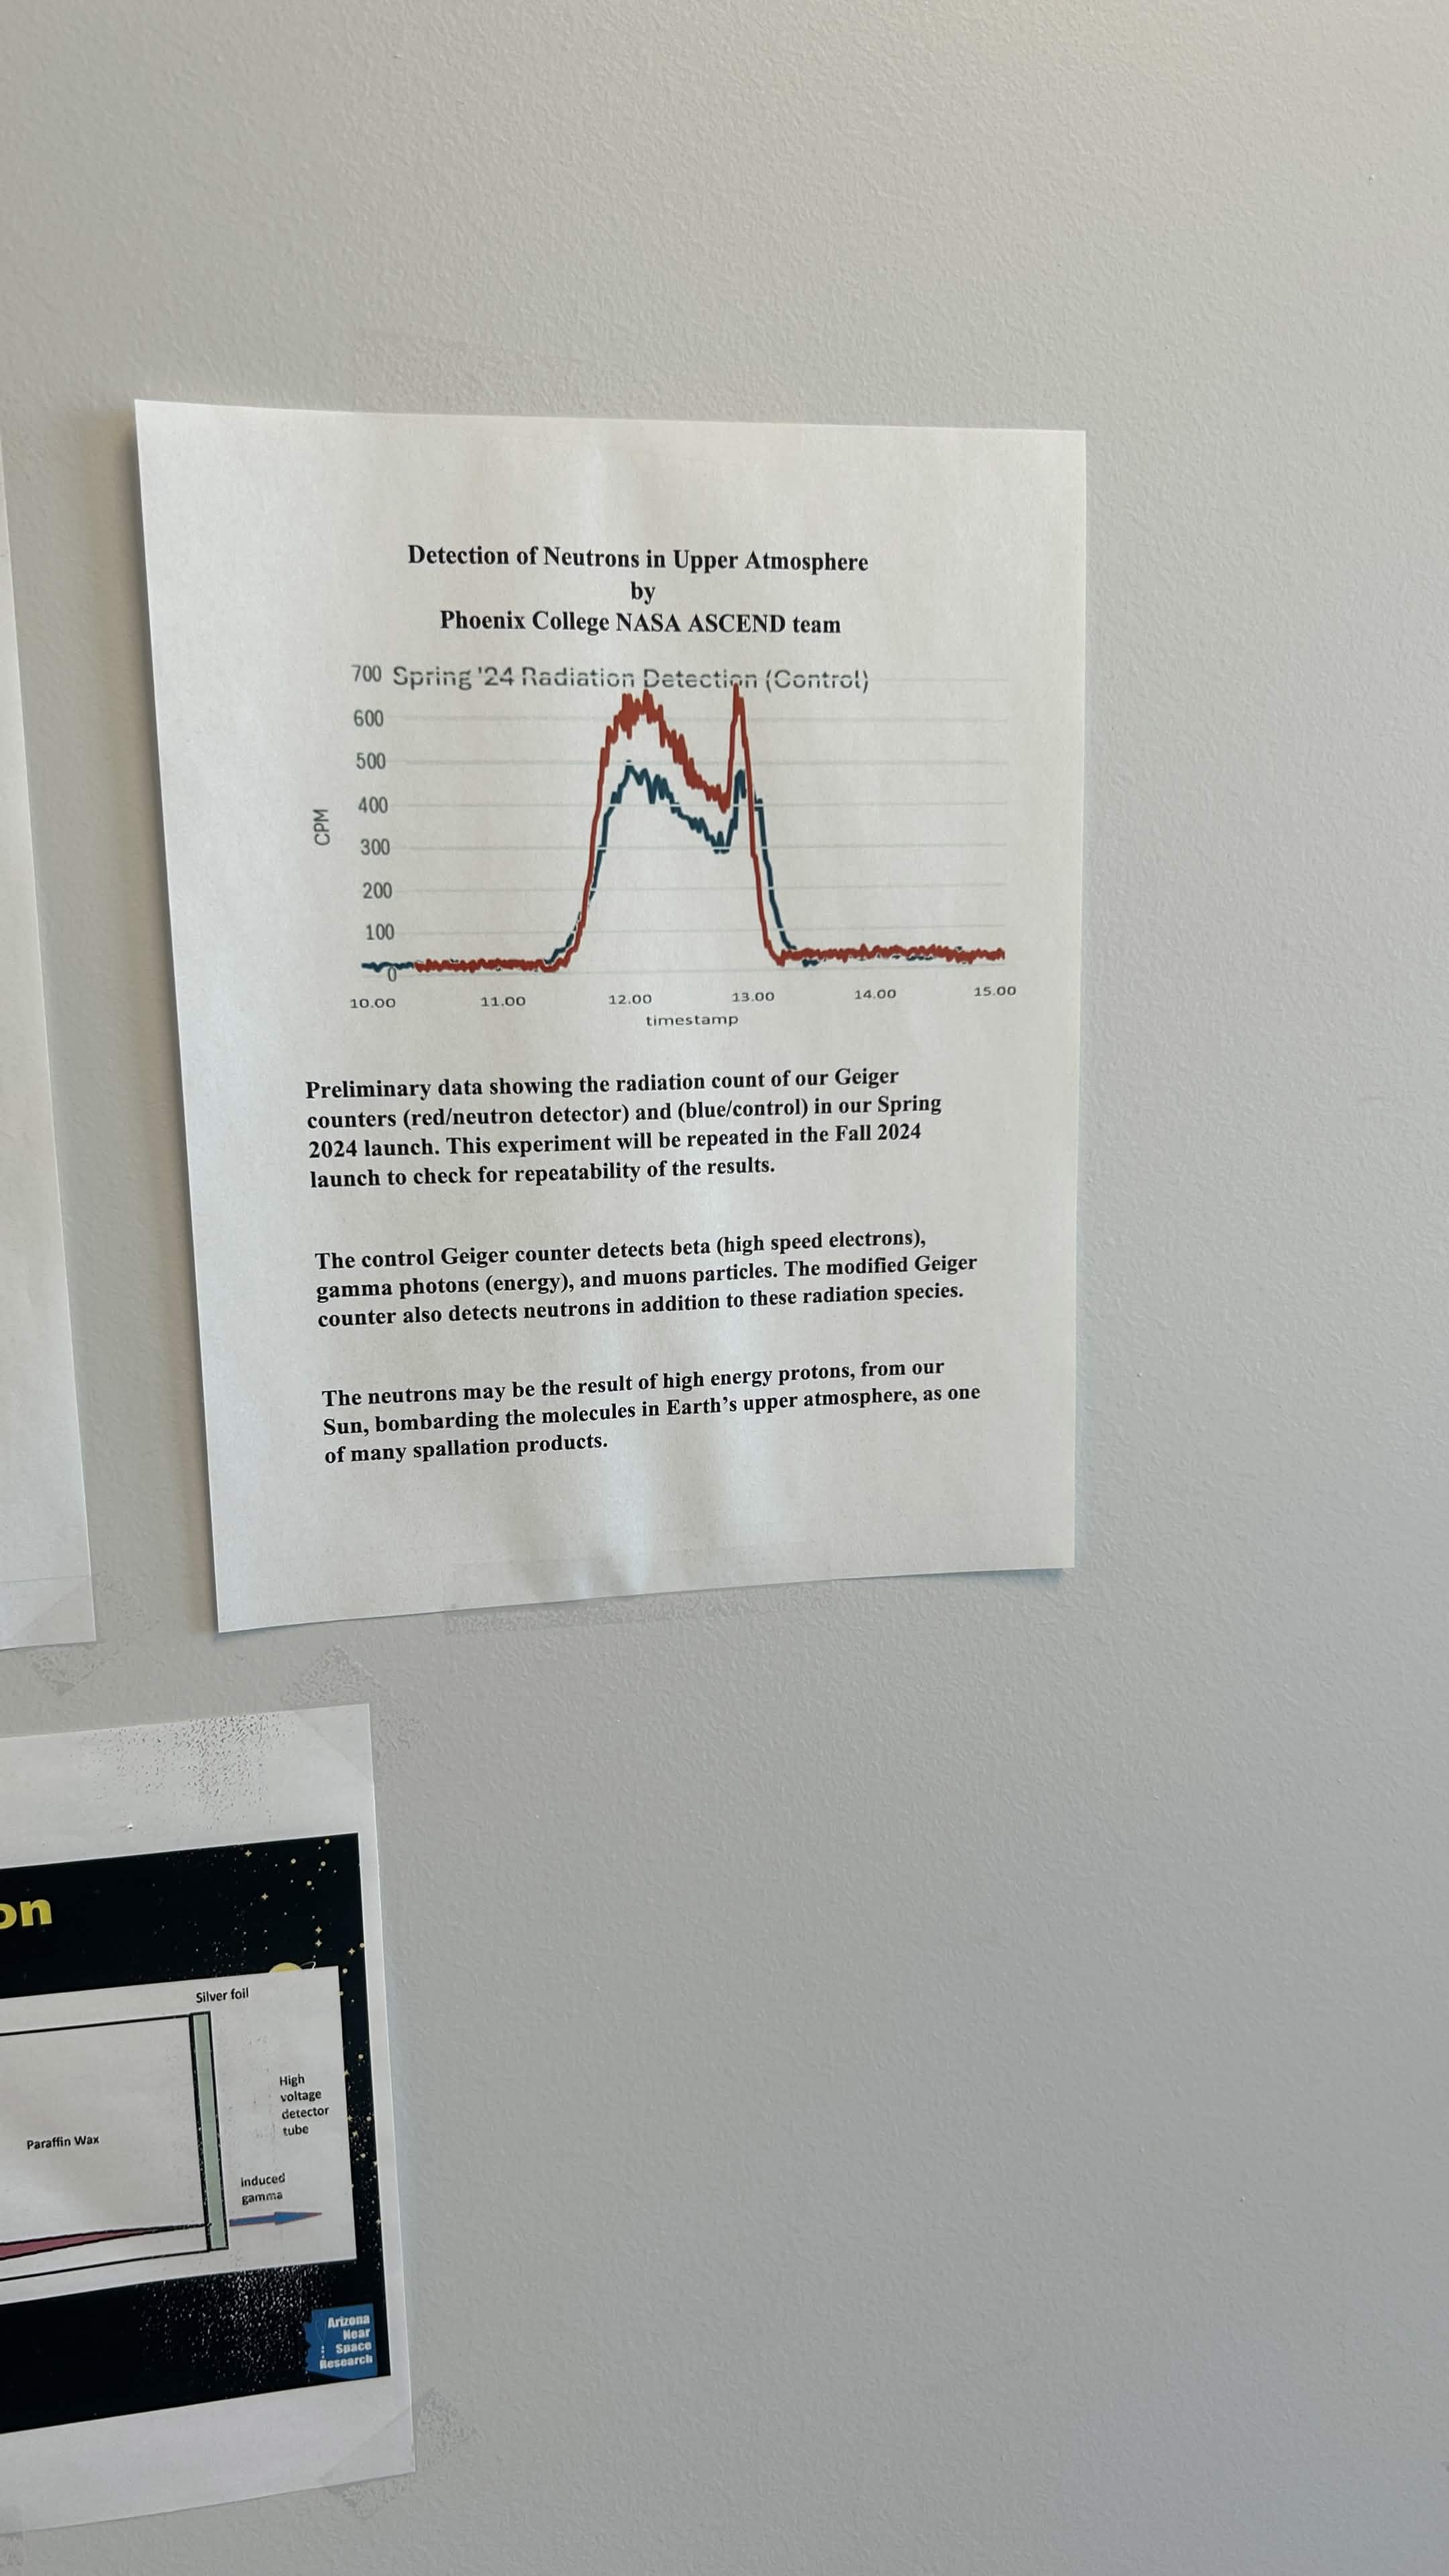
Spring 2024
Spring 2024 counter comparison
The photographed Spring 2024 display compares modified and control detector counts. This graph is distinct from the Fall 2024 trace and is not a calibrated neutron-only flux or dose.
Open related research record →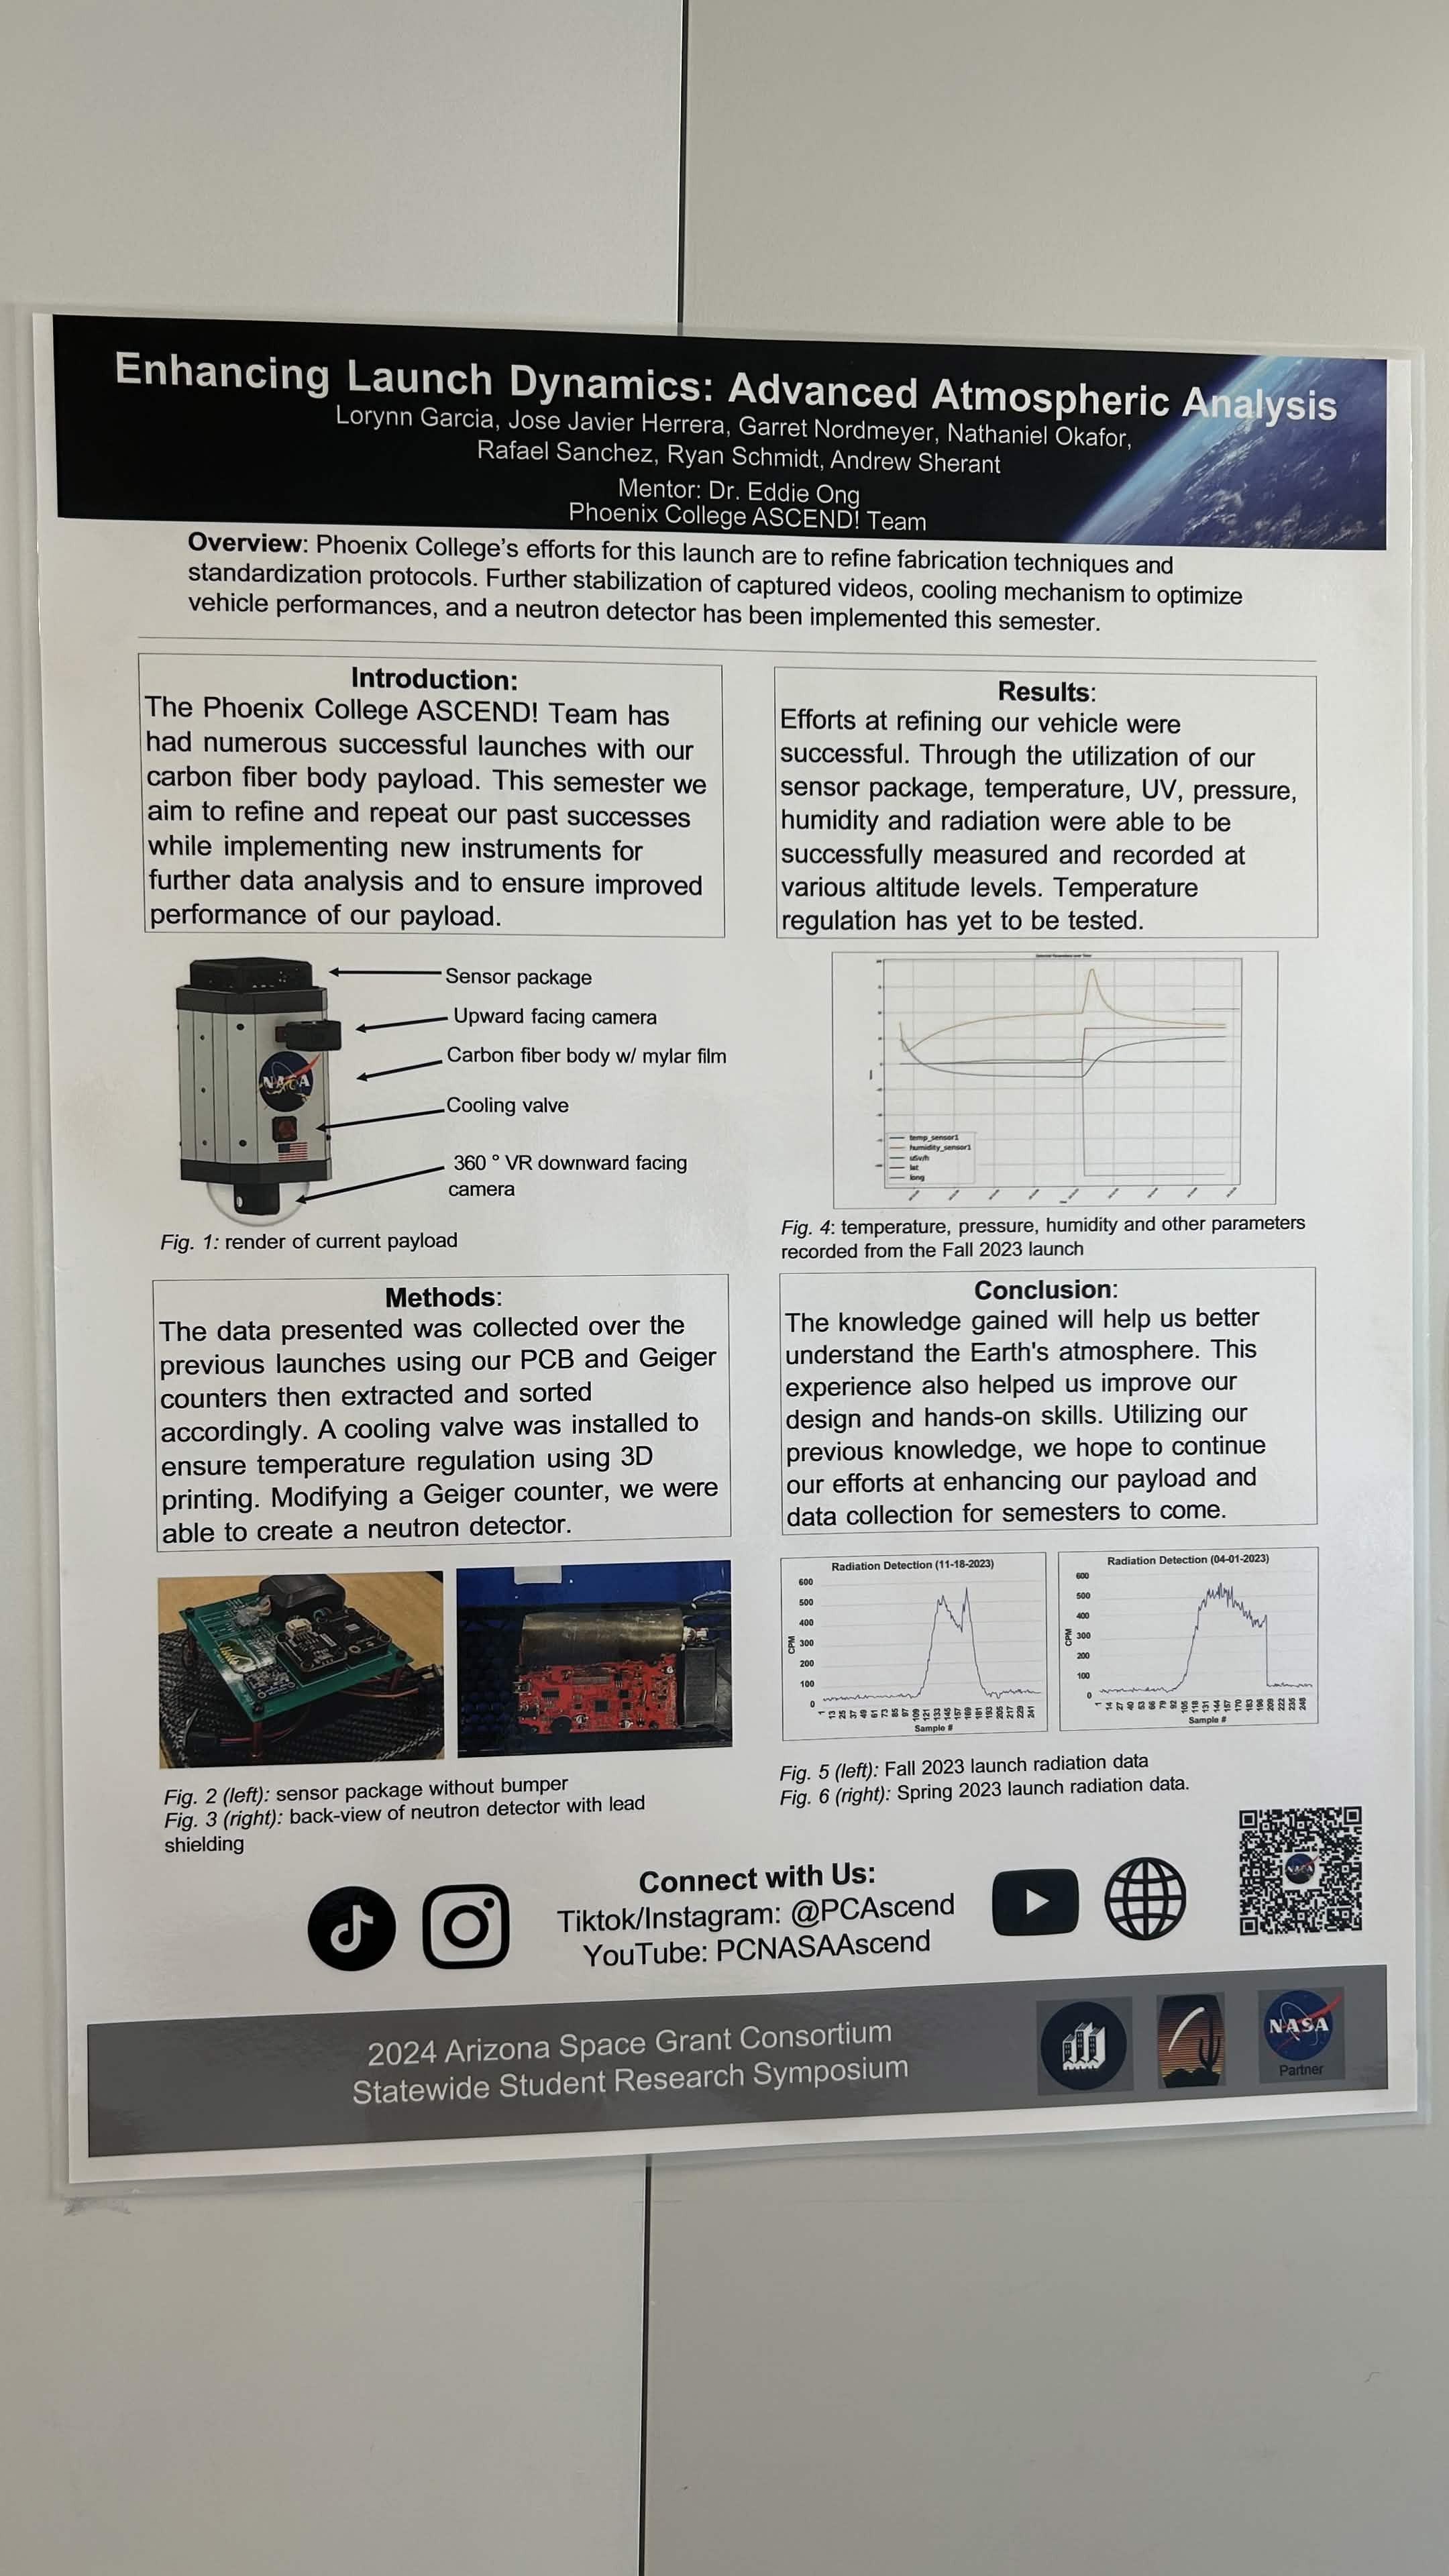
2024 symposium
2024 symposium presentation
Upper research-poster excerpt. Its results include explicitly labeled Fall and Spring 2023 graphs; presentation year is not reassigned as flight year. The lower QR and legacy mark are outside this crop.
Open related research record →