
Phoenix College NASA ASCEND / Spring 2026
Spring 2026
research record.
The latest launch through the graphs and images in the team’s acquired-data report. Flight events, atmospheric channels and detector counts stay in their original measurement scopes.
- Reported burst altitude
- 82,497 ft Authored flight image and narrative
- External temperature
- −66.5 °C Narrative; chart reaches −67.99 °C
- CO₂ channel peak
- 939 ppm Reported near 77,483 ft
Presentation figures are public. Original research documents, raw measurements, analysis files and source repositories are not provided as downloads.
Source-backed presentation
Read the actual evidence.
Every graph keeps its complete axes. Select a subject or enlarge a figure to read the labels. No smoothed replacement curves or invented observations.
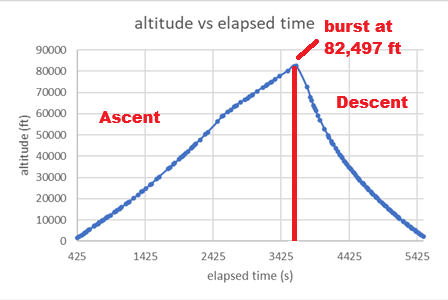
Altitude and flight sequence
The authored 2026 figure marks burst at 82,497 ft after about 61 minutes. This is the report’s correct image, not the old 2025 cache also present in the document.
Spring 2026 acquired-data report · original embedded figure 1. Original marks and axes retained.
Enlarge figure →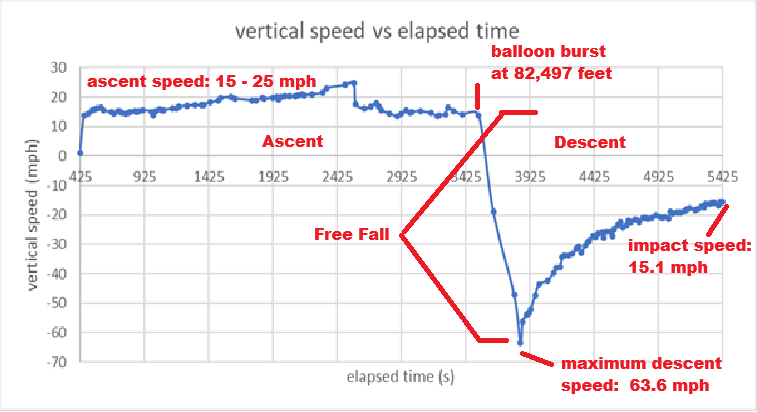
Vertical velocity
The report annotates 63.6 mph descent and approximately 15.1 mph final velocity. These are source annotations, not an independently verified touchdown measurement.
Spring 2026 acquired-data report · original embedded figure 3. Original marks and axes retained.
Enlarge figure →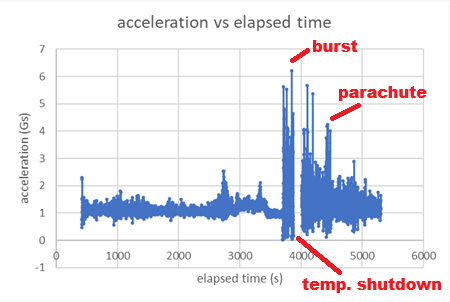
Acceleration and recovery
The source labels a 6.2 G burst jolt, a second 5.7 G jolt and a 4 G parachute event. A temporary shutdown interrupts the record; no continuous interpolation is implied.
Spring 2026 acquired-data report · original embedded figure 4. Original marks and axes retained.
Enlarge figure →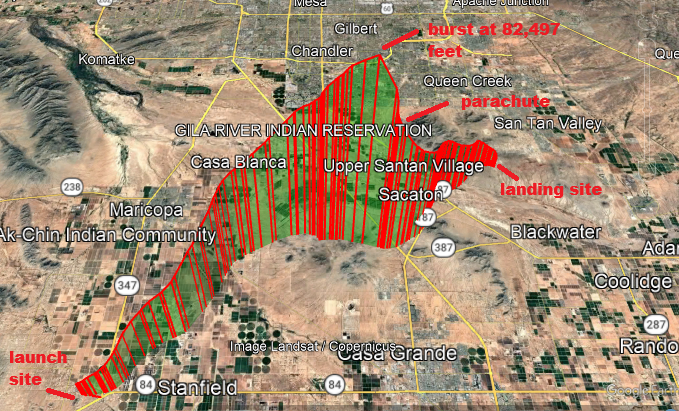
Published flight trajectory
The team’s authored map marks an 82,497 ft maximum. It is a presentation image, not a downloadable coordinate track.
Spring 2026 acquired-data report · original embedded figure 2. Original marks and axes retained.
Enlarge figure →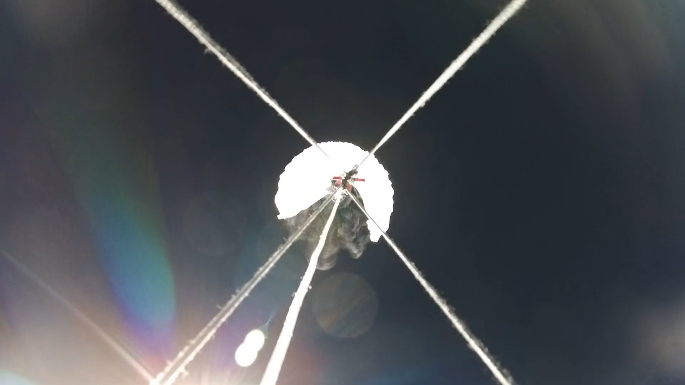
Asymmetric balloon burst
The original camera frame records the asymmetric balloon opening. Visual evidence of the burst is not a new measurement reconstructed from video.
Spring 2026 acquired-data report · original embedded figure 5. Original marks and axes retained.
Enlarge figure →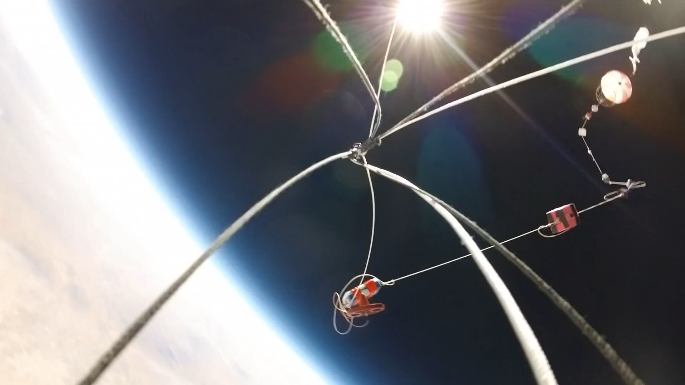
Flight-train motion
The source image illustrates helical response of the flight train. Perspective alone does not establish a calibrated rotation rate.
Spring 2026 acquired-data report · original embedded figure 6. Original marks and axes retained.
Enlarge figure →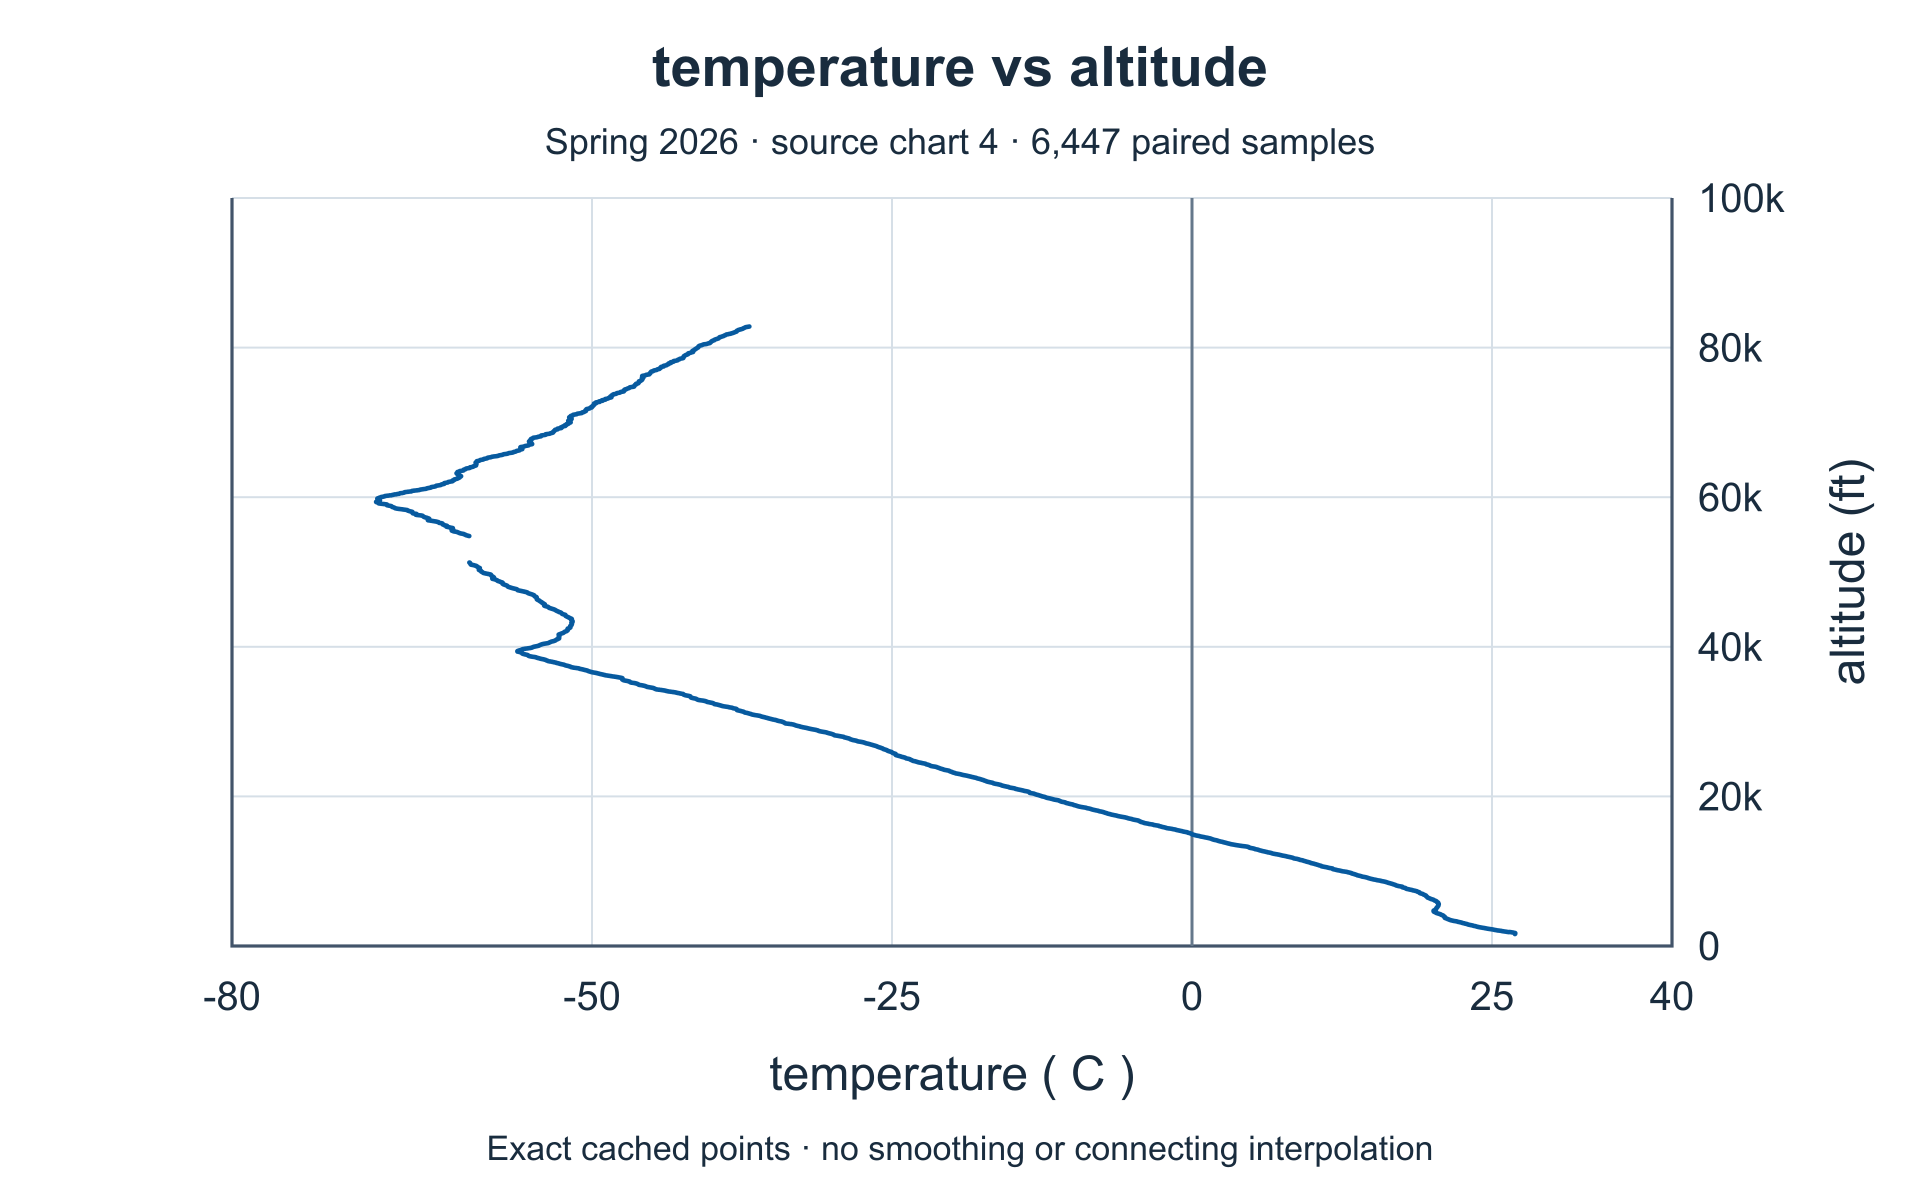
External temperature versus altitude
Prose states −66.5 °C; retained chart values reach −67.99 °C. The difference is disclosed instead of replacing one with the other.
Spring 2026 acquired-data report · chart 4. Rendered from retained report values; raw series remain private. Horizontal: °C. Vertical: report altitude (ft).
Enlarge figure →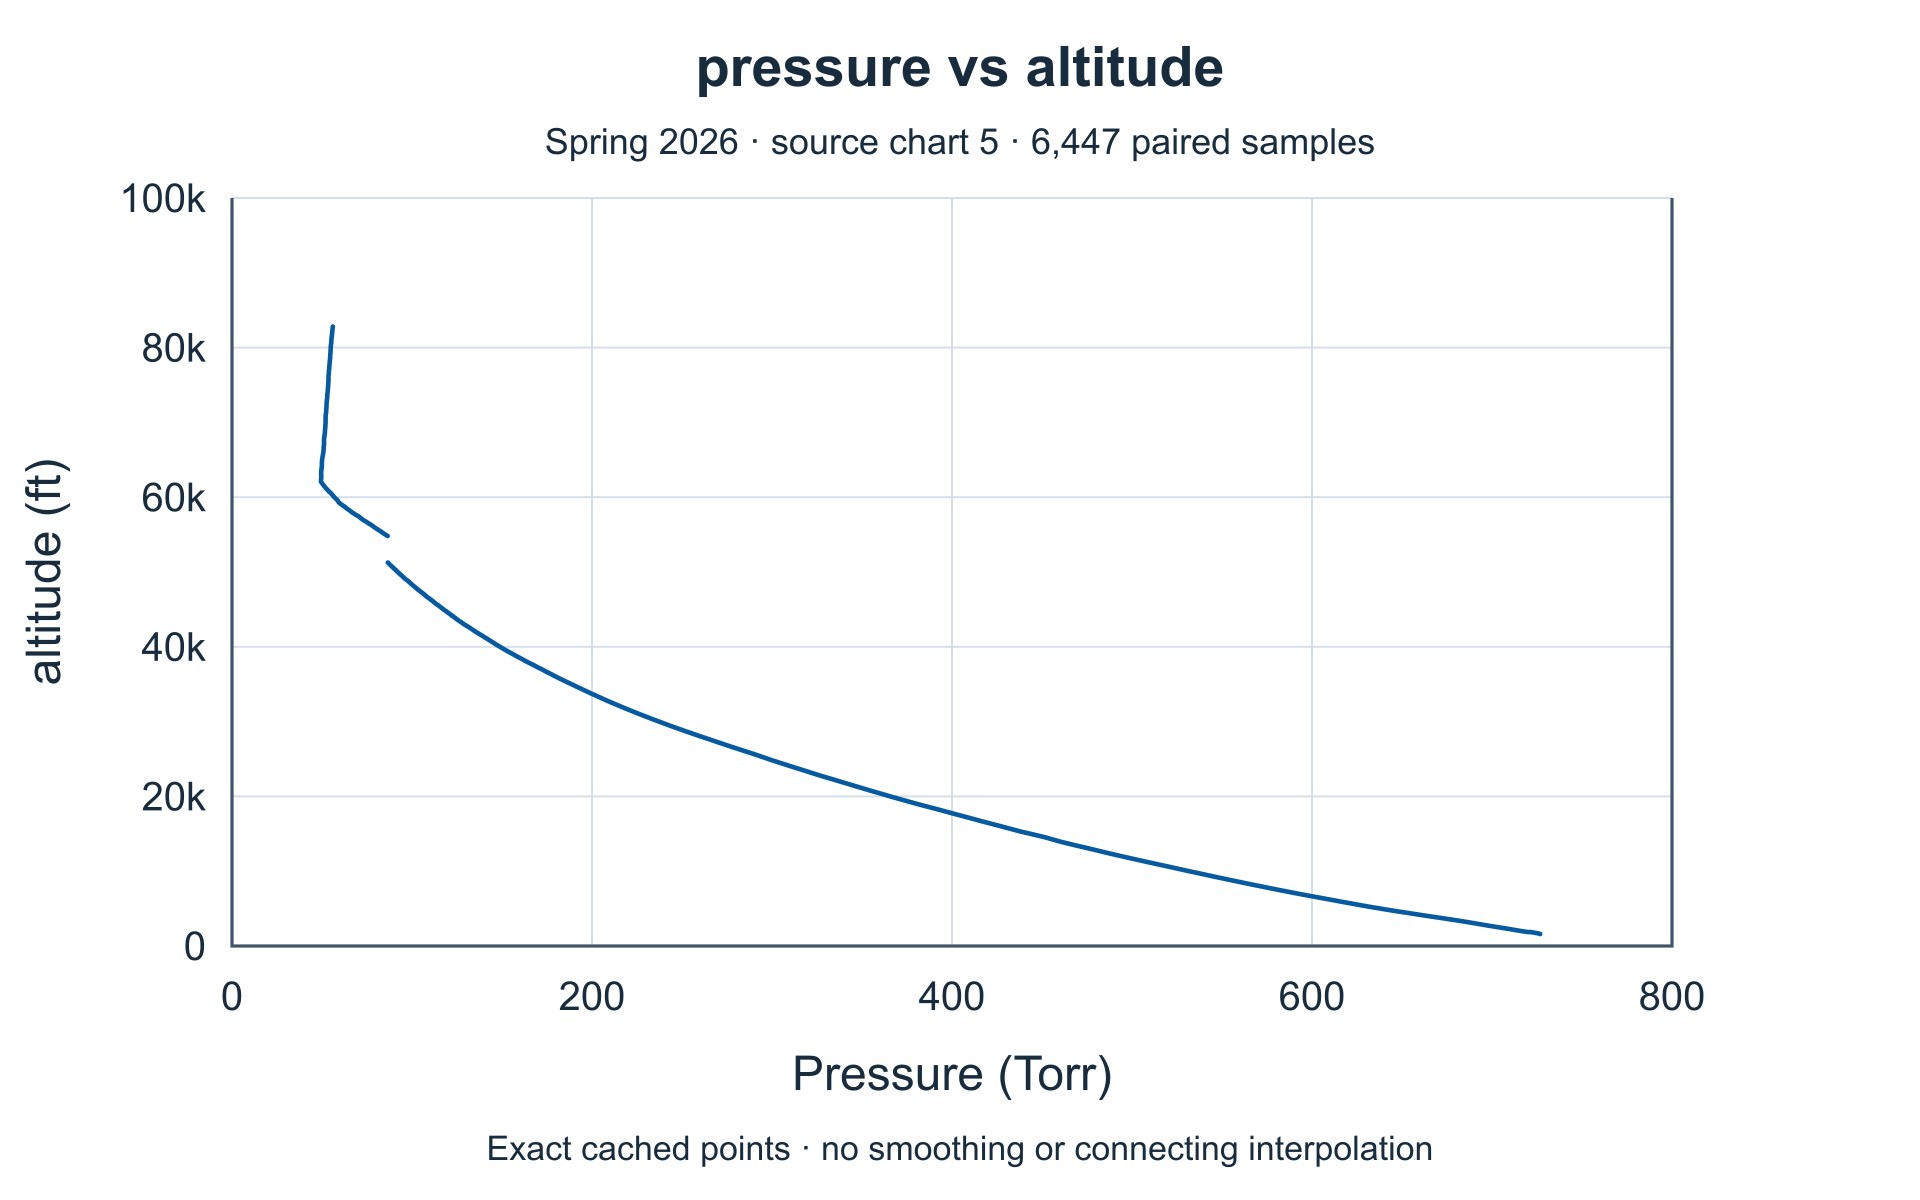
Pressure versus altitude
Prose states 49.2 Torr minimum; retained chart values reach 49.429 Torr. This is the report’s altitude channel, not synchronized APRS altitude.
Spring 2026 acquired-data report · chart 5. Rendered from retained report values; raw series remain private. Horizontal: Torr. Vertical: report altitude (ft).
Enlarge figure →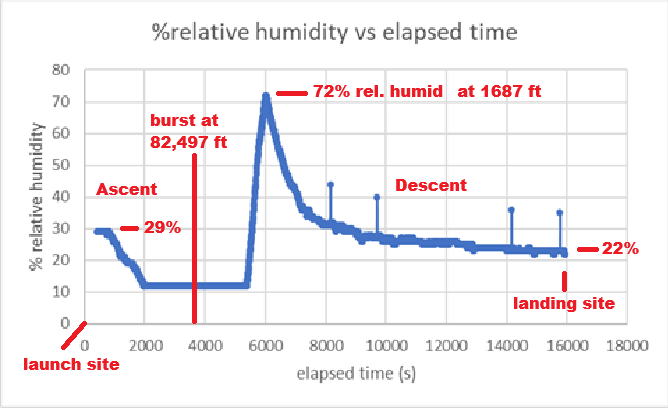
Relative humidity on the recorder clock
The source uses elapsed seconds horizontally, not altitude. It marks approximately 72% RH near 1,687 ft during descent. Do not align this clock with another recorder without synchronization.
Spring 2026 acquired-data report · original embedded figure 7. Original marks and axes retained.
Enlarge figure →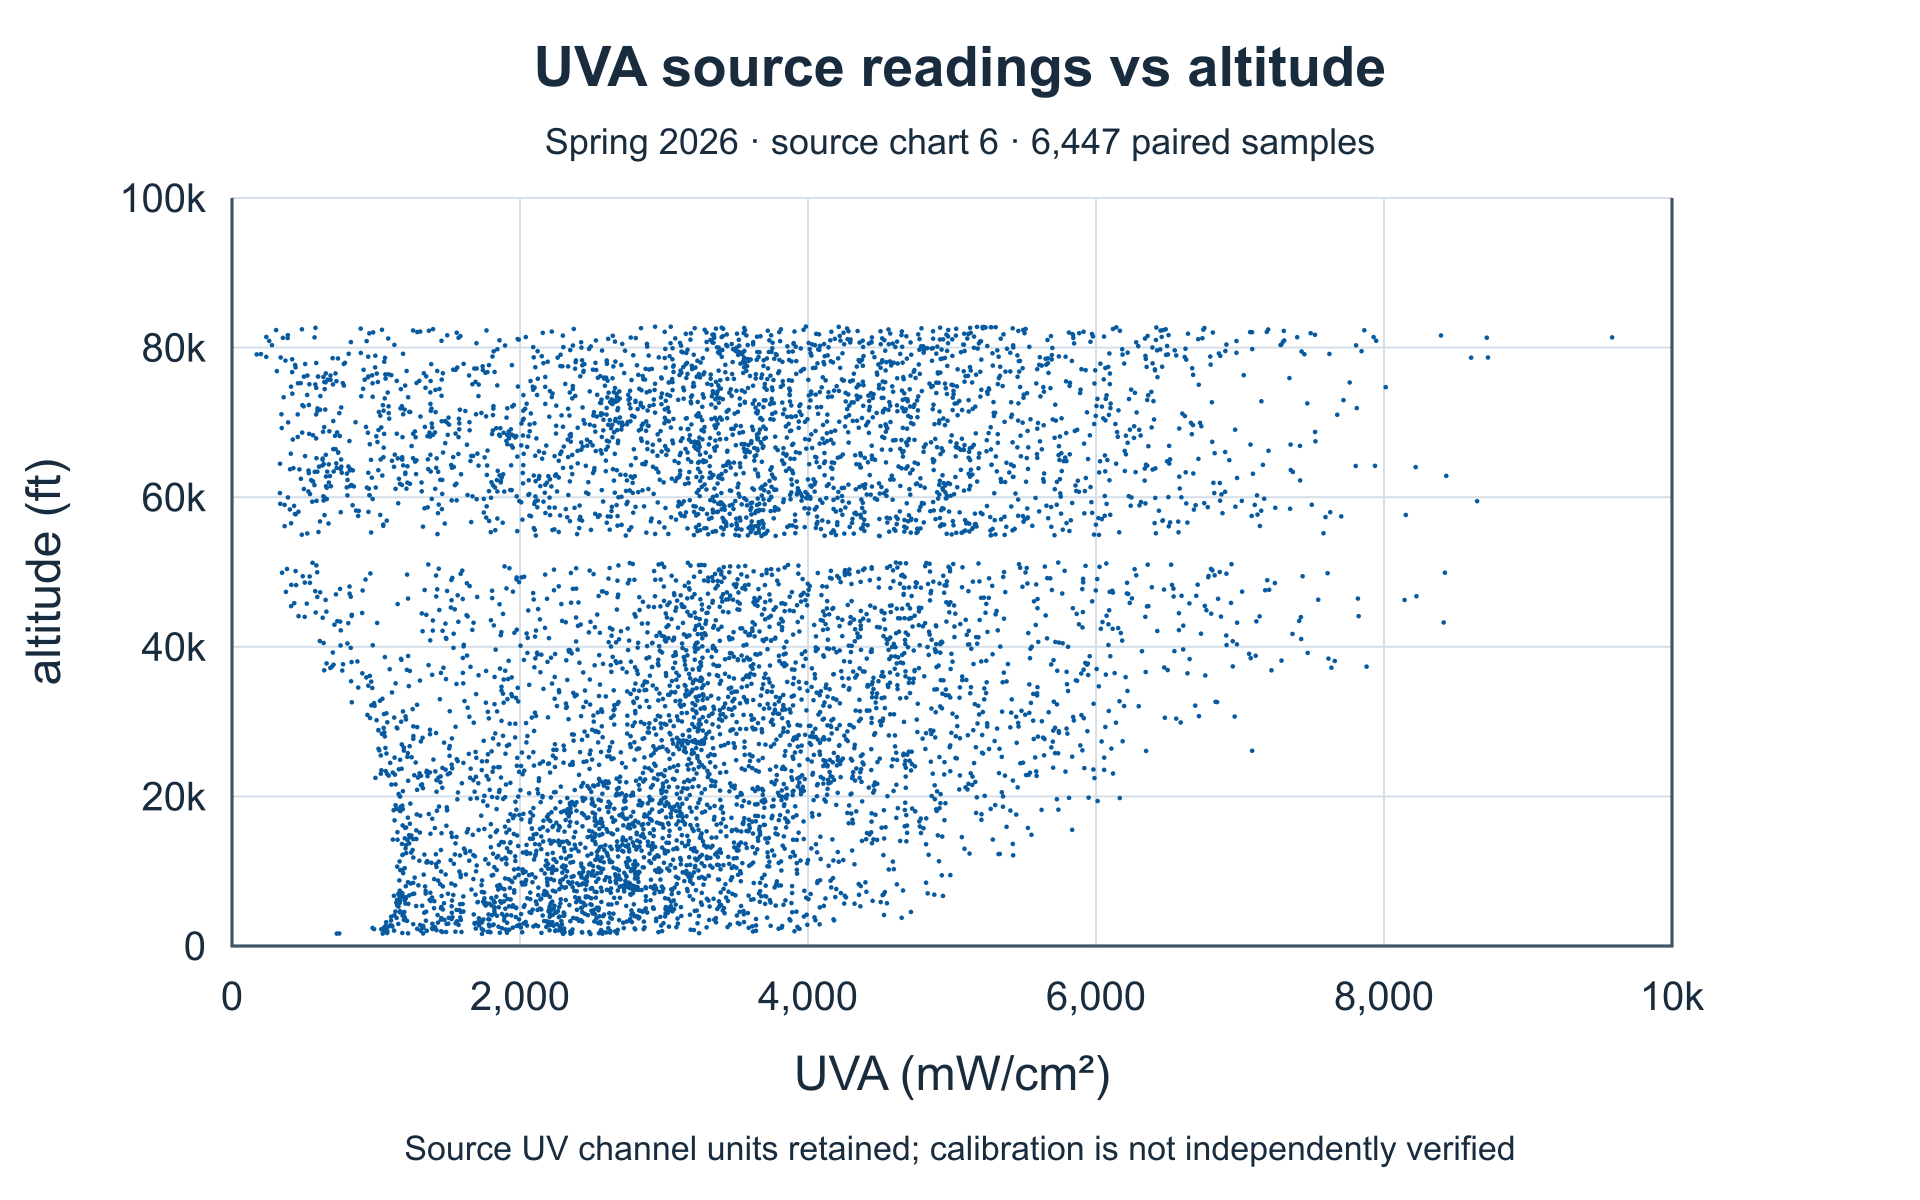
UVA channel versus altitude
The source averages four side-mounted sensors. These channels are not established as calibrated irradiance; noise and shutdown/recovery remain visible.
Spring 2026 acquired-data report · chart 6. Rendered from retained report values; raw series remain private. Horizontal: source UV output (mW/cm² as labeled; calibration unverified). Vertical: report altitude (ft).
Enlarge figure →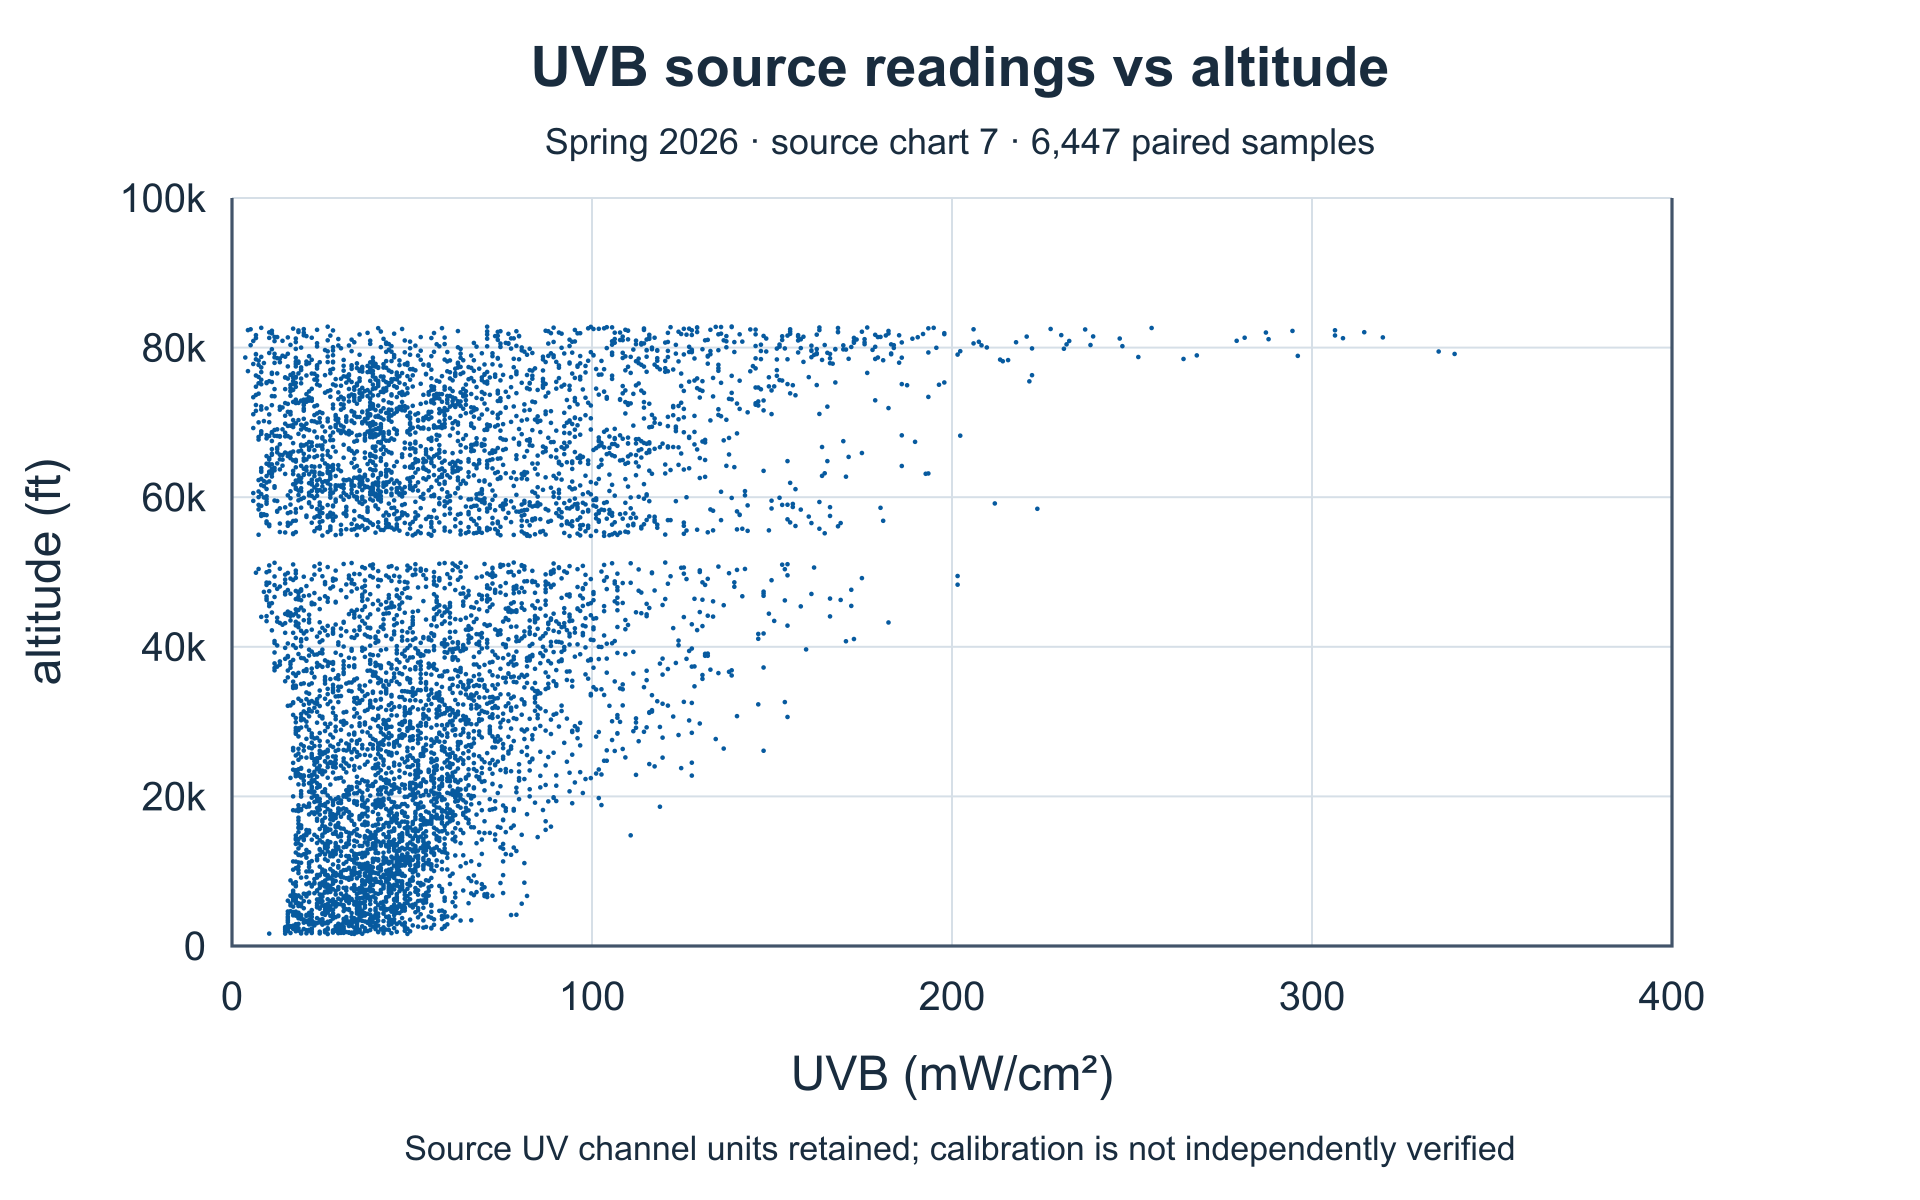
UVB channel versus altitude
This sensor channel is not a UV index or dose measurement. Its numerical scale is not interchangeable with other UV channels.
Spring 2026 acquired-data report · chart 7. Rendered from retained report values; raw series remain private. Horizontal: source UV output (mW/cm² as labeled; calibration unverified). Vertical: report altitude (ft).
Enlarge figure →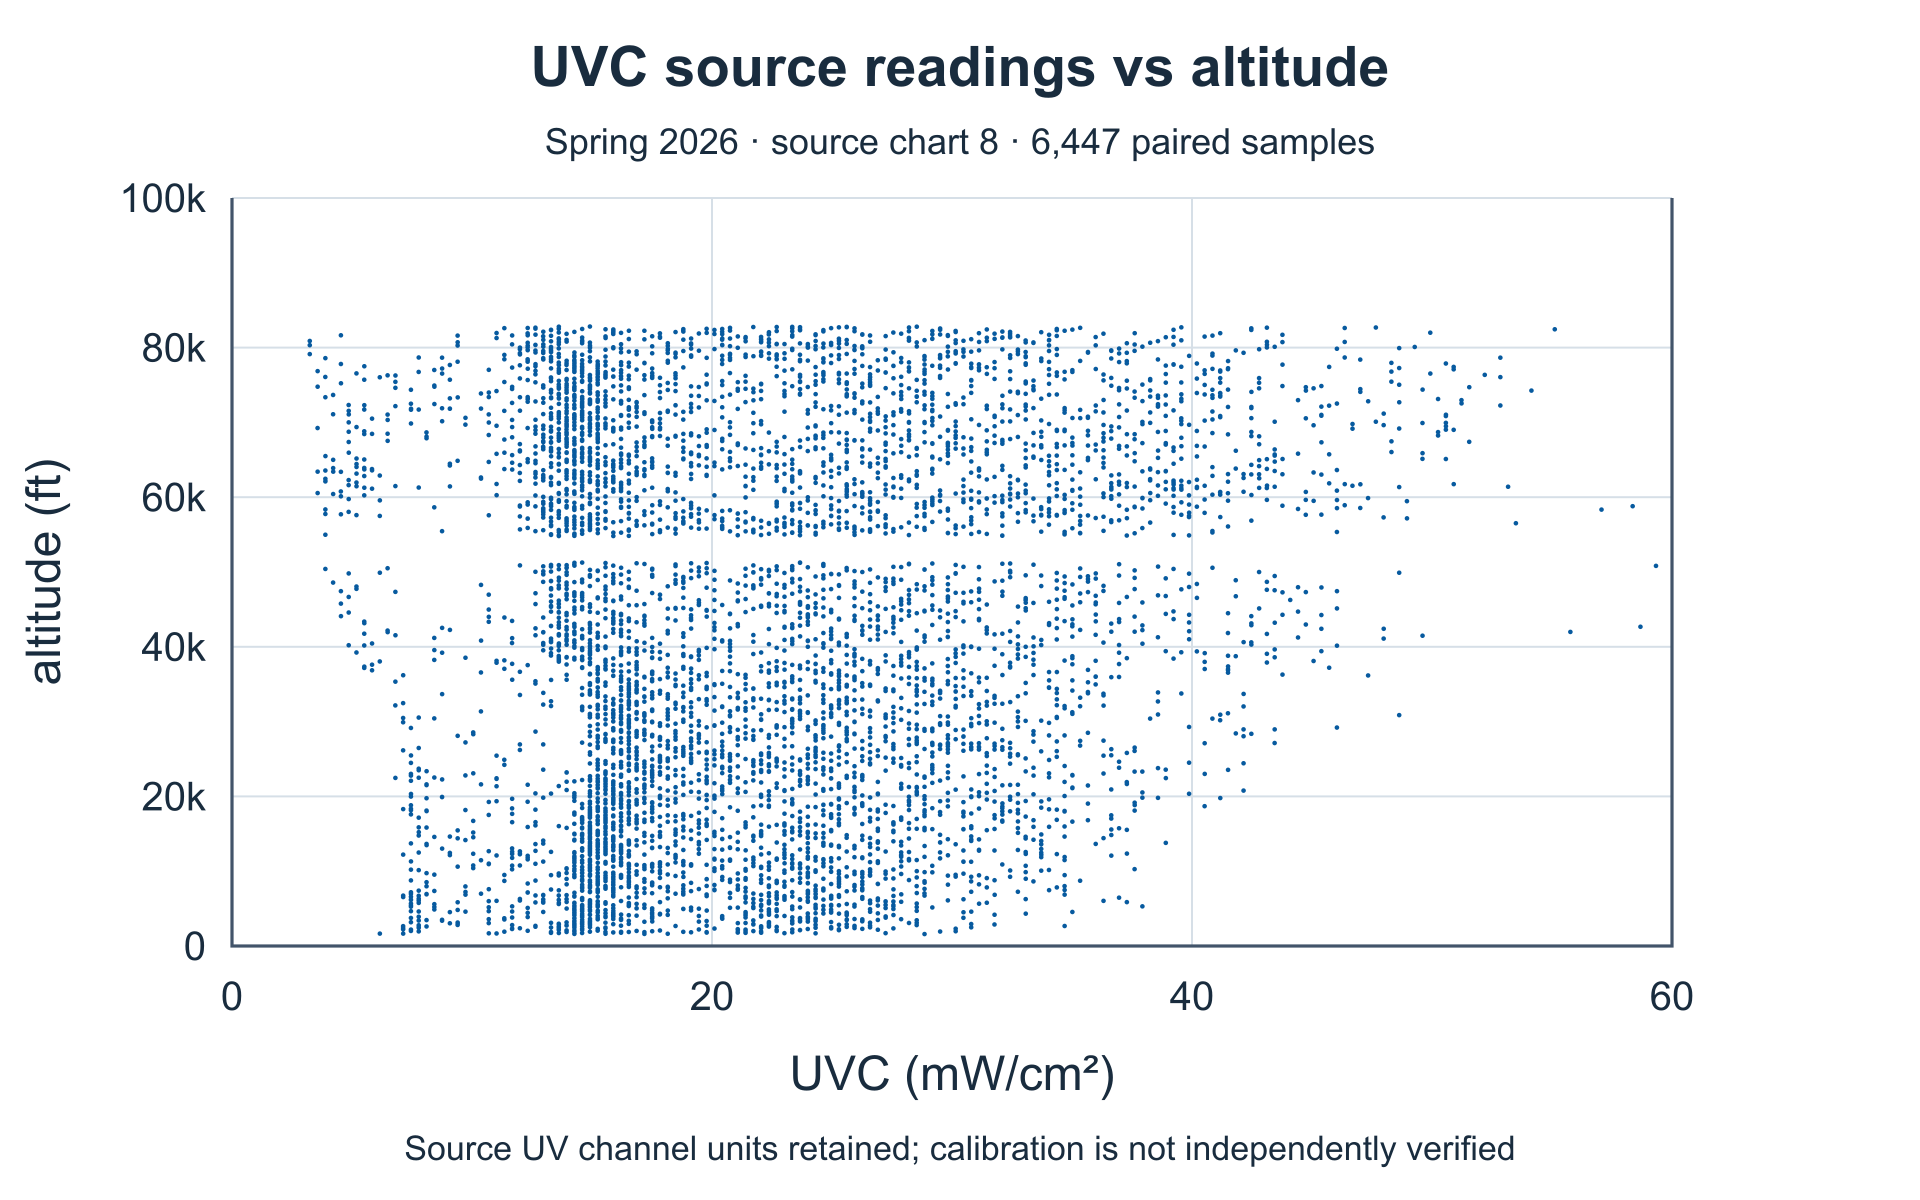
UVC channel versus altitude
Nonzero UVC channel response does not establish ambient UVC exposure. Spectral response, cross-sensitivity and calibration need review.
Spring 2026 acquired-data report · chart 8. Rendered from retained report values; raw series remain private. Horizontal: source UV output (mW/cm² as labeled; calibration unverified). Vertical: report altitude (ft).
Enlarge figure →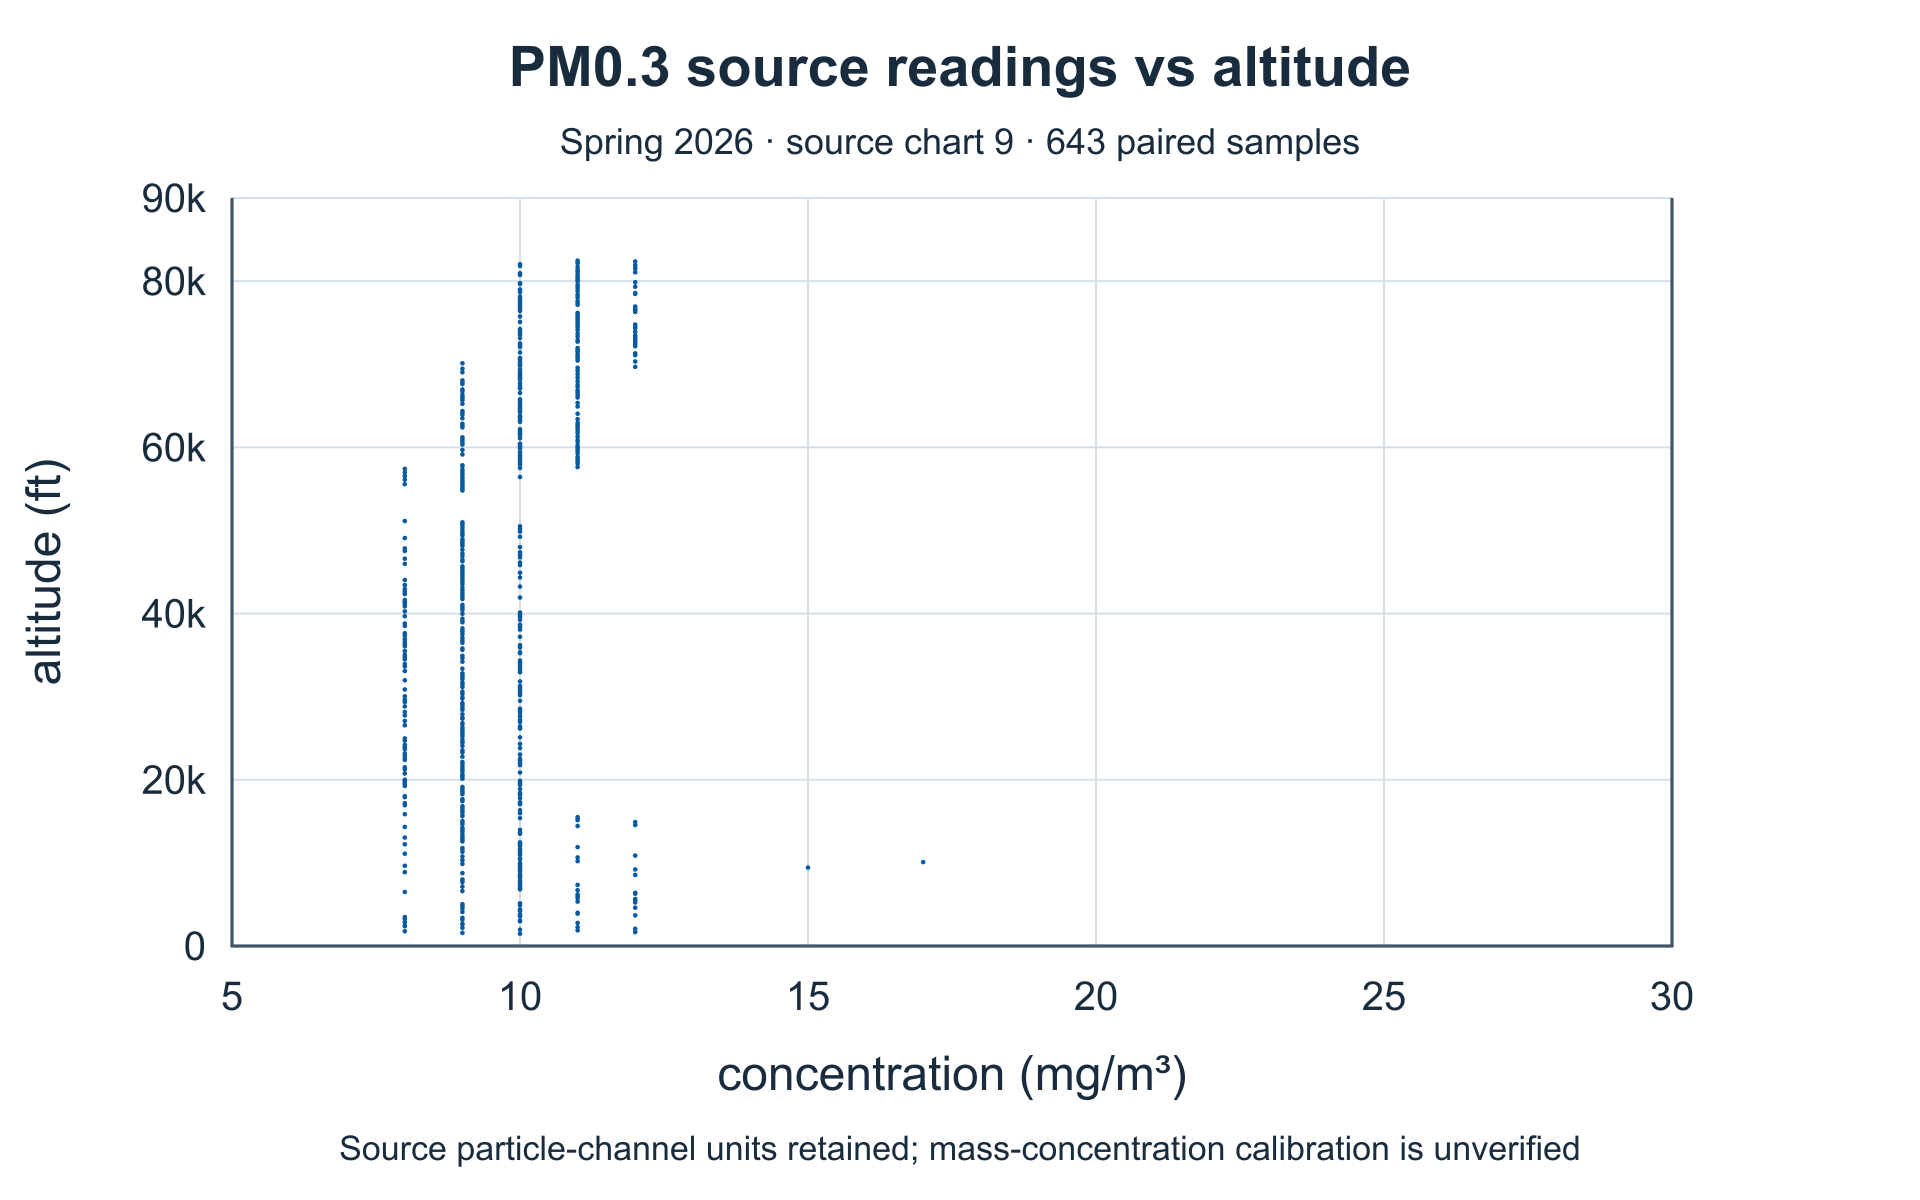
Particulate channel PM0.3 versus altitude
The source labels mg/m³. Units and calibration are not independently established and differ from Fall 2025’s µg/m³. No cross-year concentration comparison is claimed.
Spring 2026 acquired-data report · chart 9. Rendered from retained report values; raw series remain private. Horizontal: source channel (mg/m³ as labeled). Vertical: report altitude (ft).
Enlarge figure →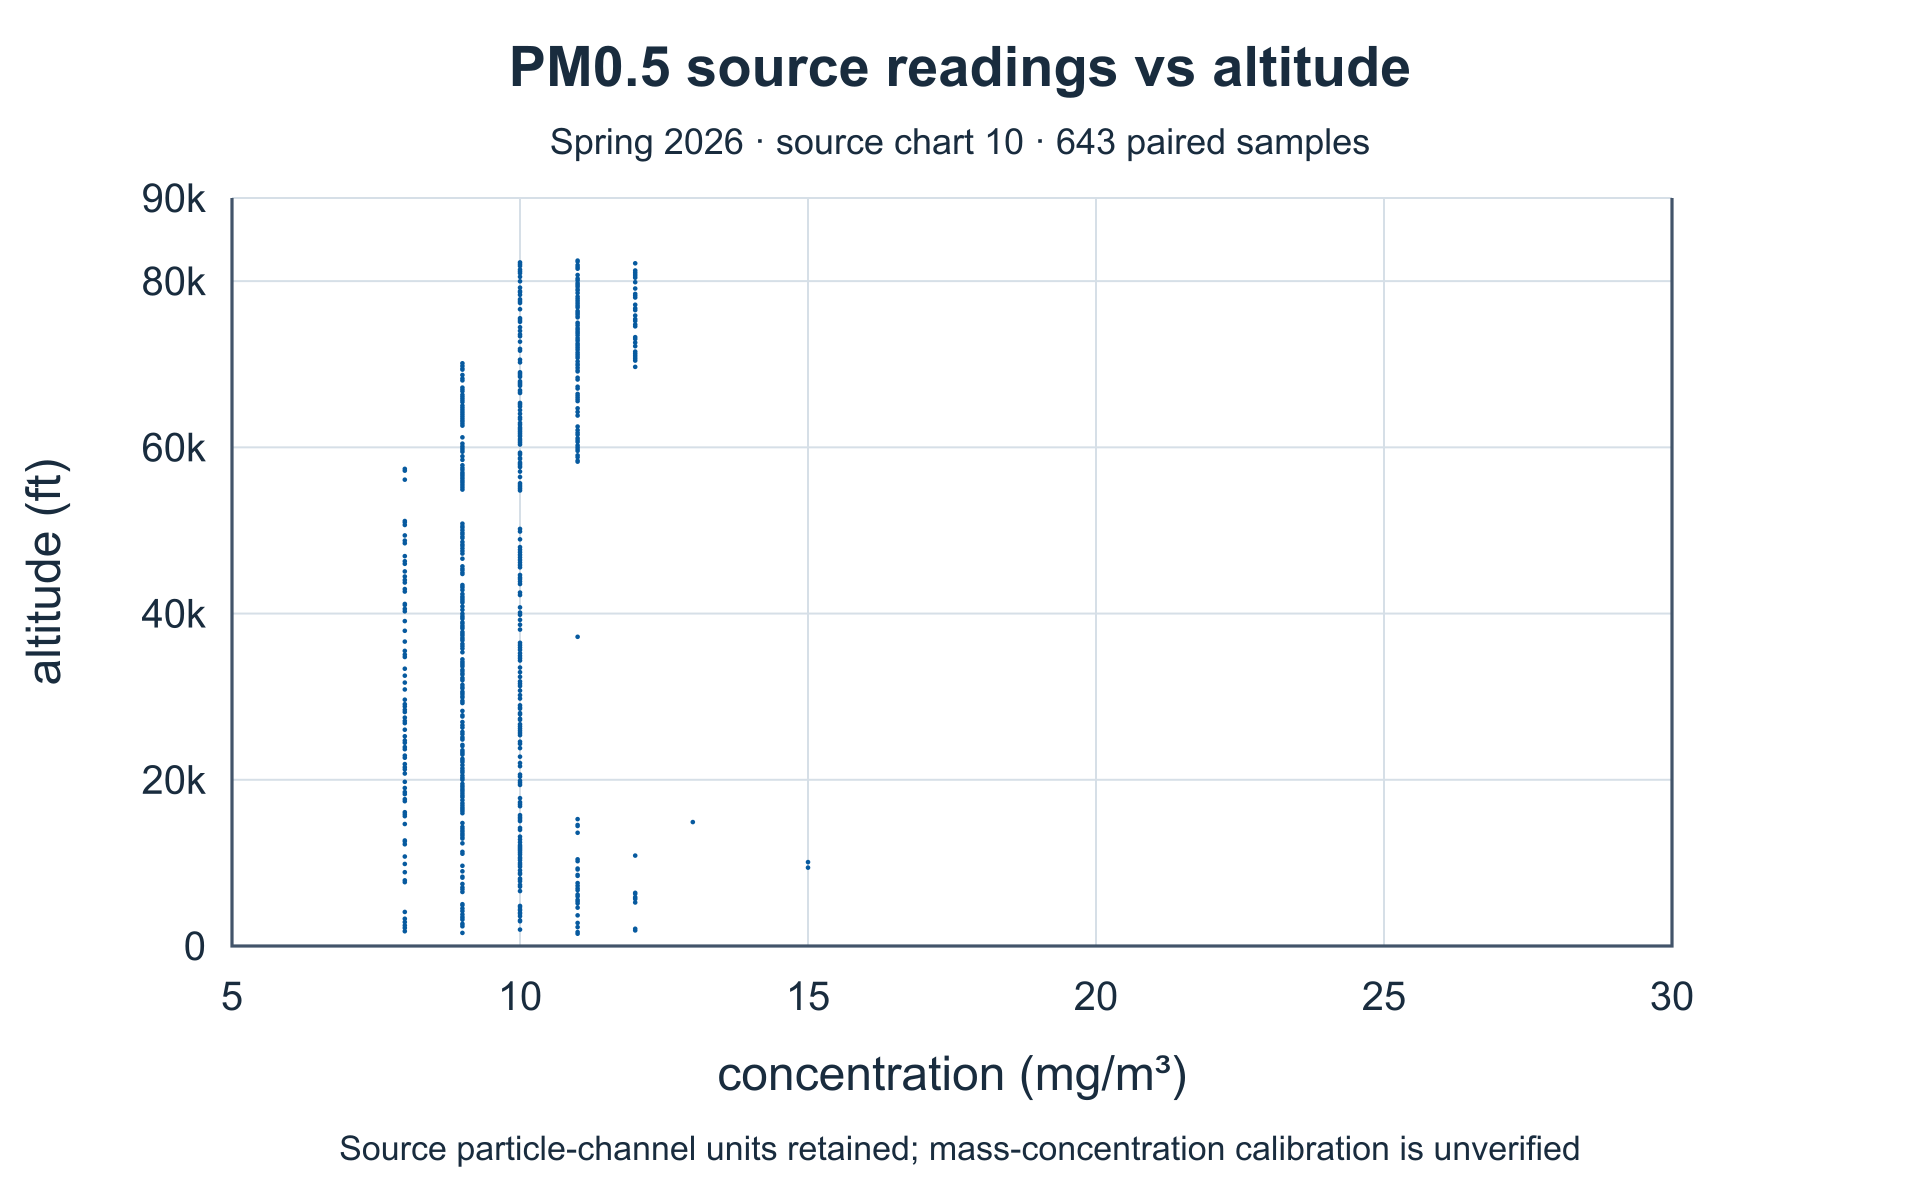
Particulate channel PM0.5 versus altitude
The source labels mg/m³. Units and calibration are not independently established and differ from Fall 2025’s µg/m³. No cross-year concentration comparison is claimed.
Spring 2026 acquired-data report · chart 10. Rendered from retained report values; raw series remain private. Horizontal: source channel (mg/m³ as labeled). Vertical: report altitude (ft).
Enlarge figure →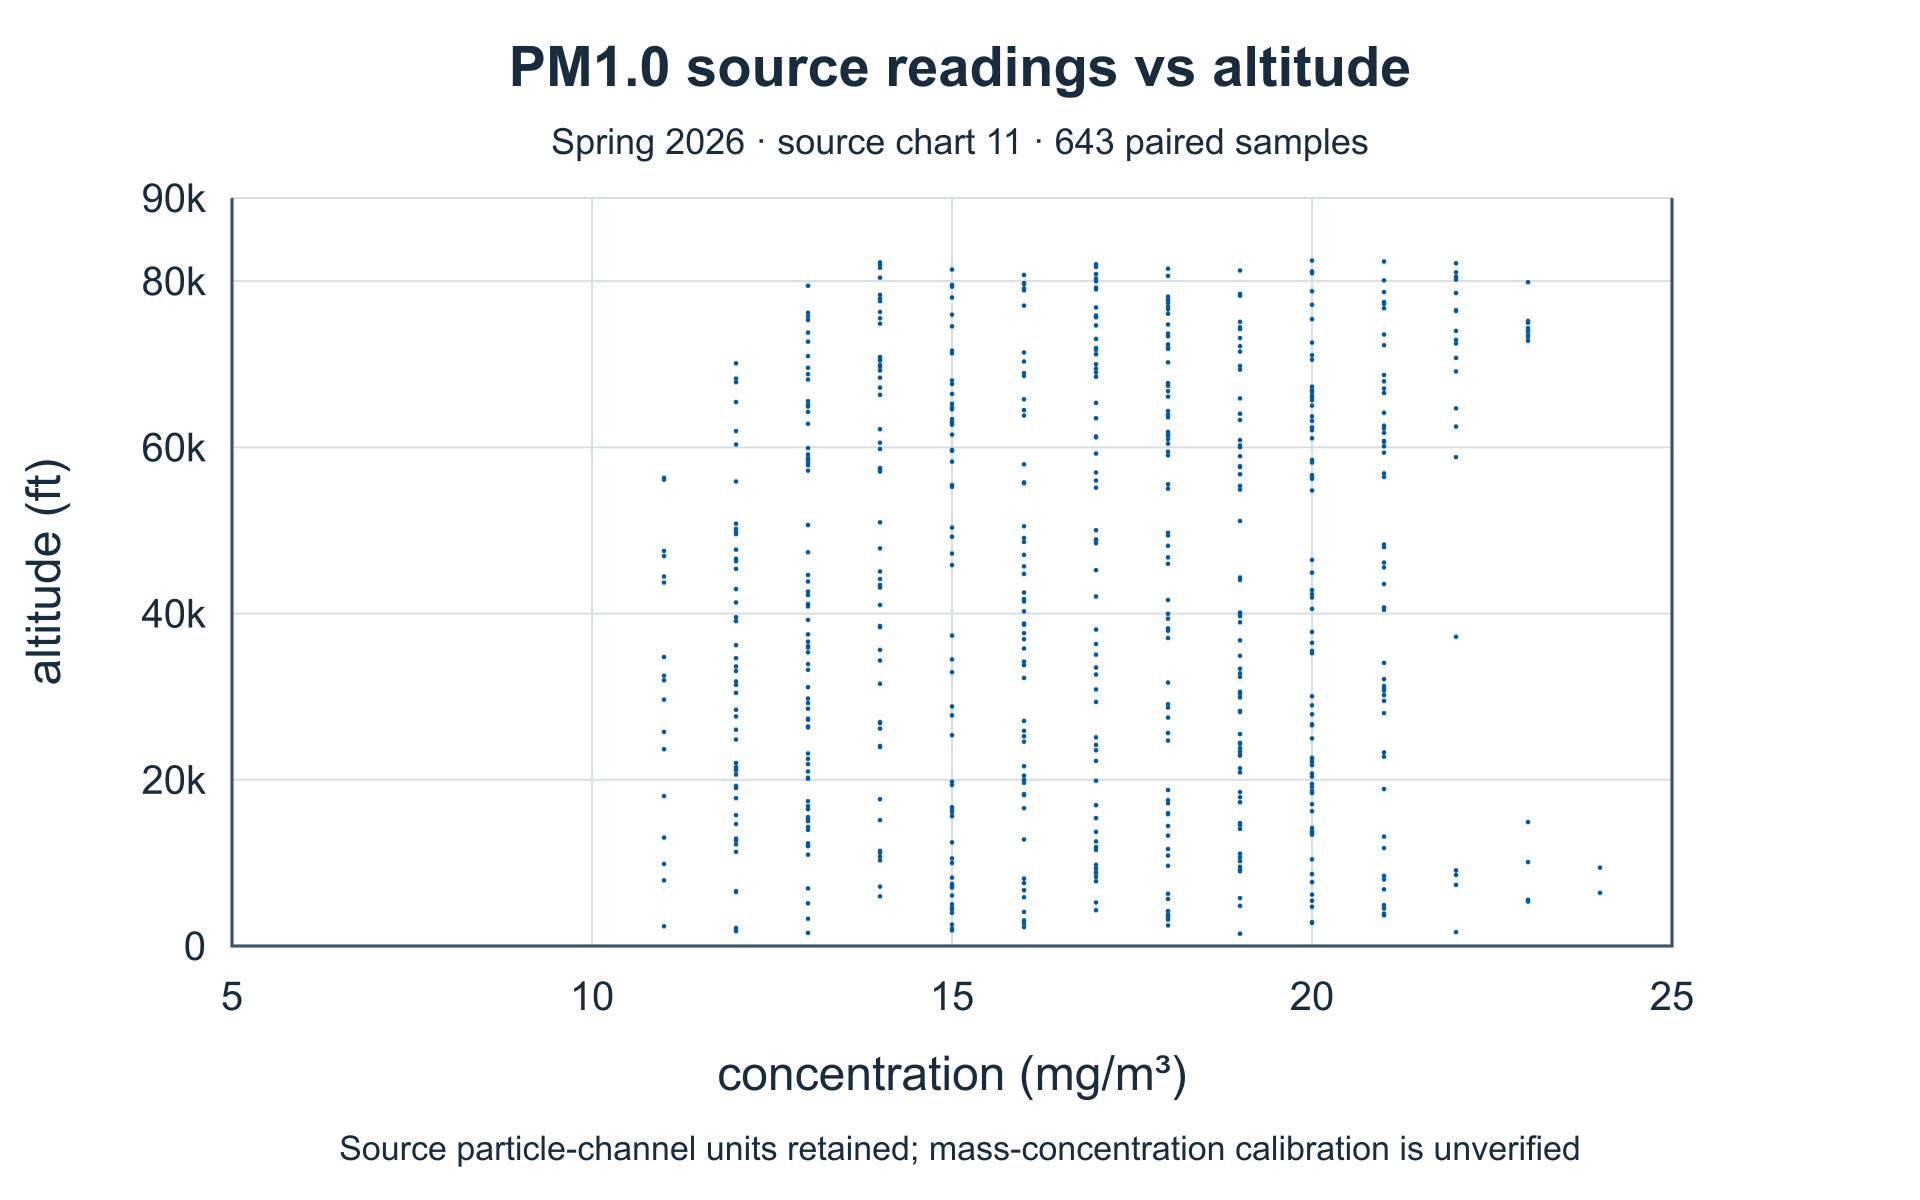
Particulate channel PM1 versus altitude
The source labels mg/m³. Units and calibration are not independently established and differ from Fall 2025’s µg/m³. No cross-year concentration comparison is claimed.
Spring 2026 acquired-data report · chart 11. Rendered from retained report values; raw series remain private. Horizontal: source channel (mg/m³ as labeled). Vertical: report altitude (ft).
Enlarge figure →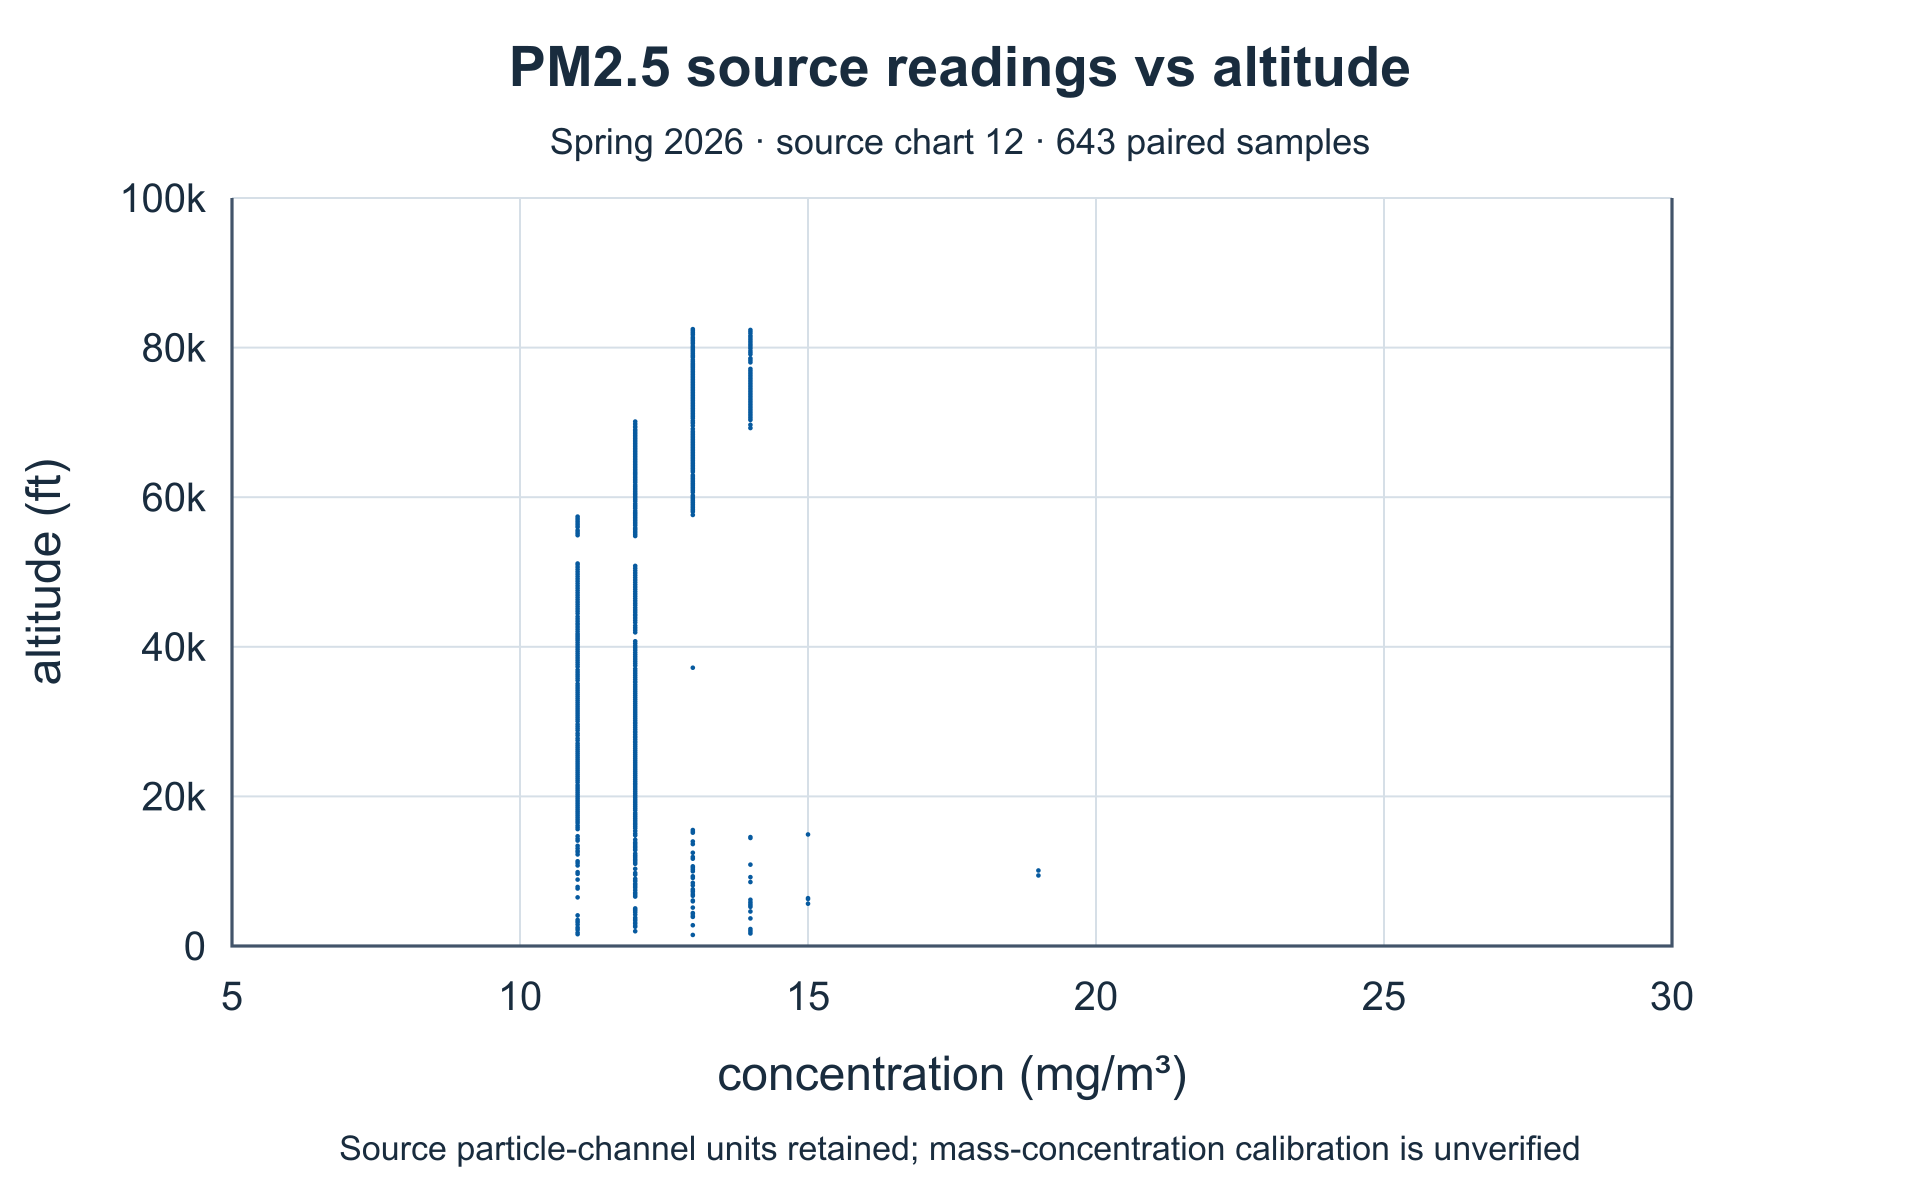
Particulate channel PM2.5 versus altitude
The source labels mg/m³. Units and calibration are not independently established and differ from Fall 2025’s µg/m³. No cross-year concentration comparison is claimed.
Spring 2026 acquired-data report · chart 12. Rendered from retained report values; raw series remain private. Horizontal: source channel (mg/m³ as labeled). Vertical: report altitude (ft).
Enlarge figure →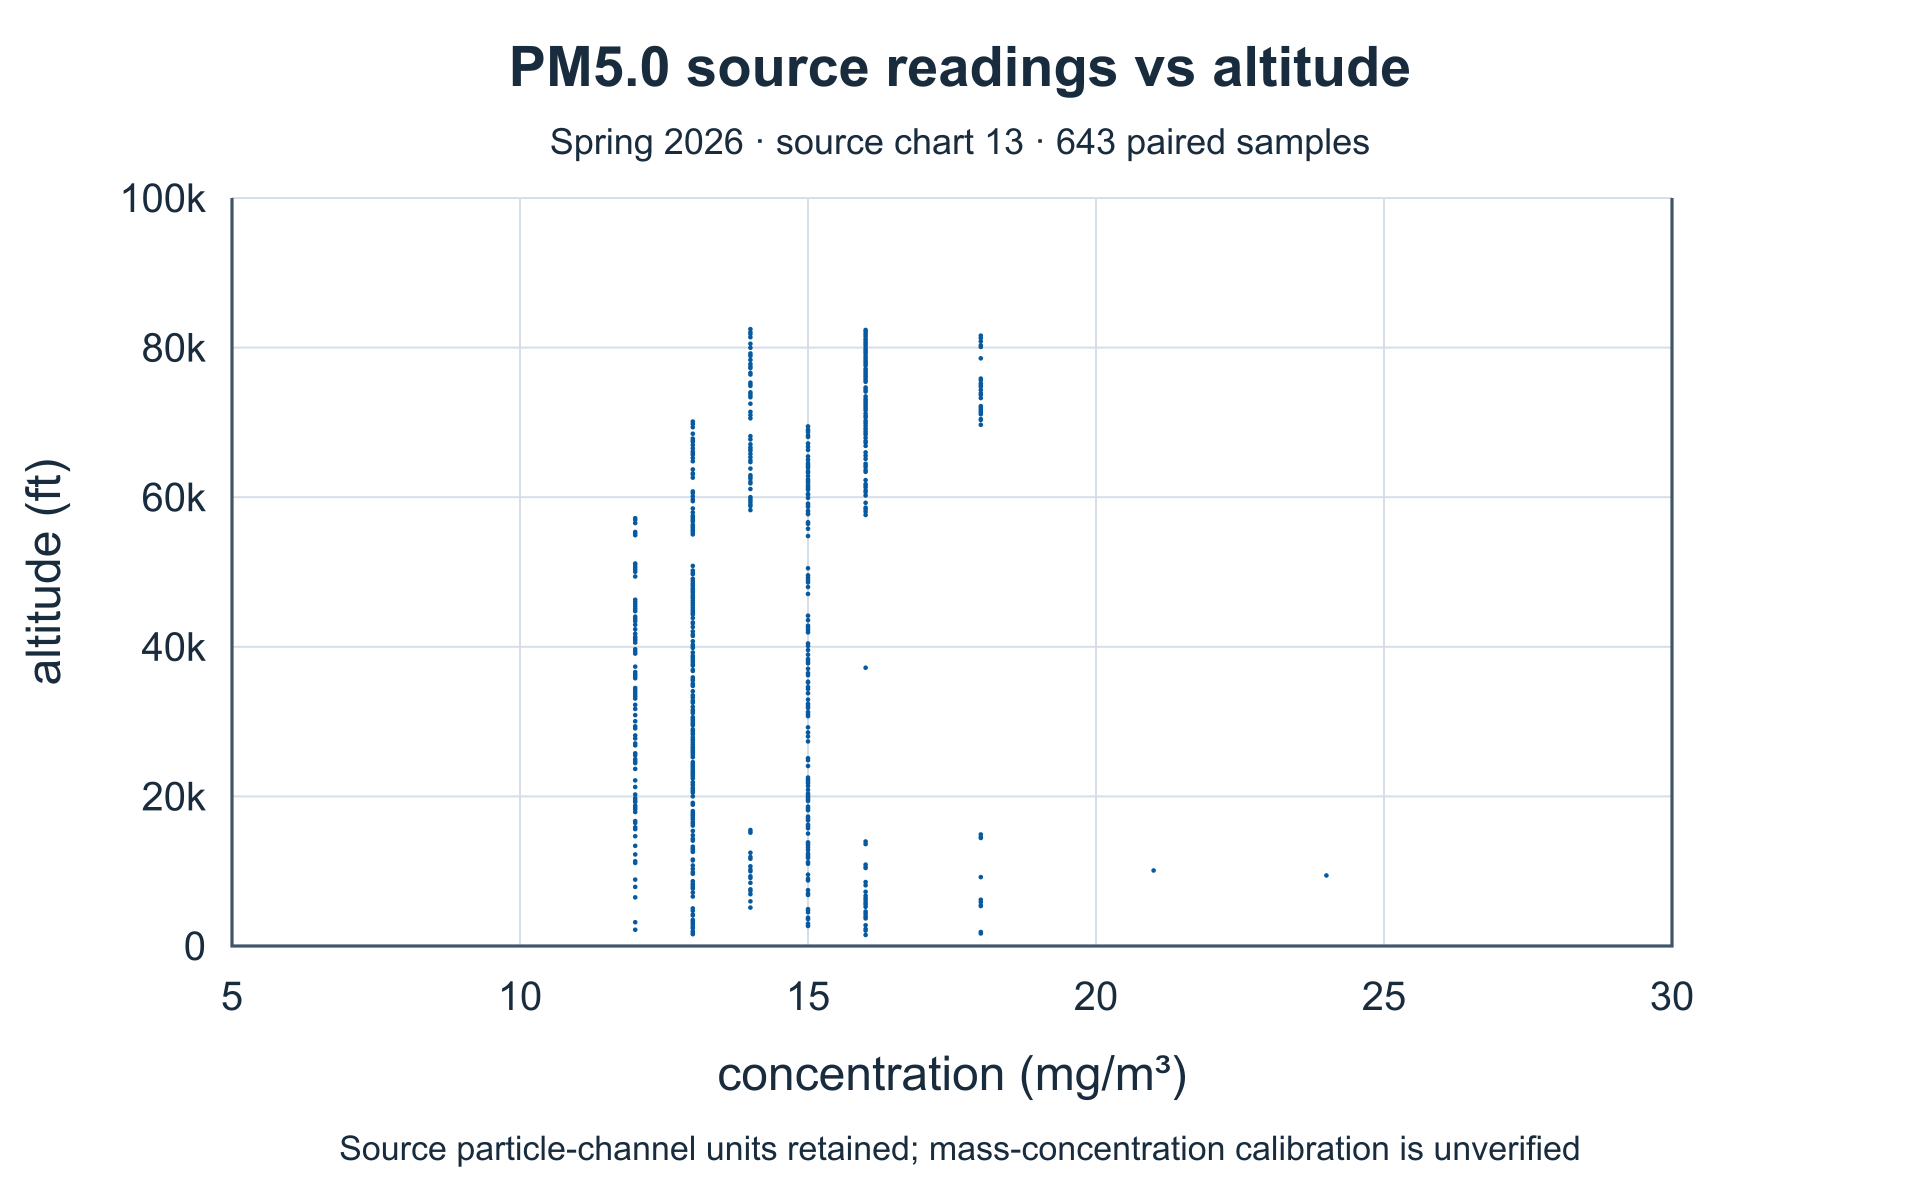
Particulate channel PM5 versus altitude
The source labels mg/m³. Units and calibration are not independently established and differ from Fall 2025’s µg/m³. No cross-year concentration comparison is claimed.
Spring 2026 acquired-data report · chart 13. Rendered from retained report values; raw series remain private. Horizontal: source channel (mg/m³ as labeled). Vertical: report altitude (ft).
Enlarge figure →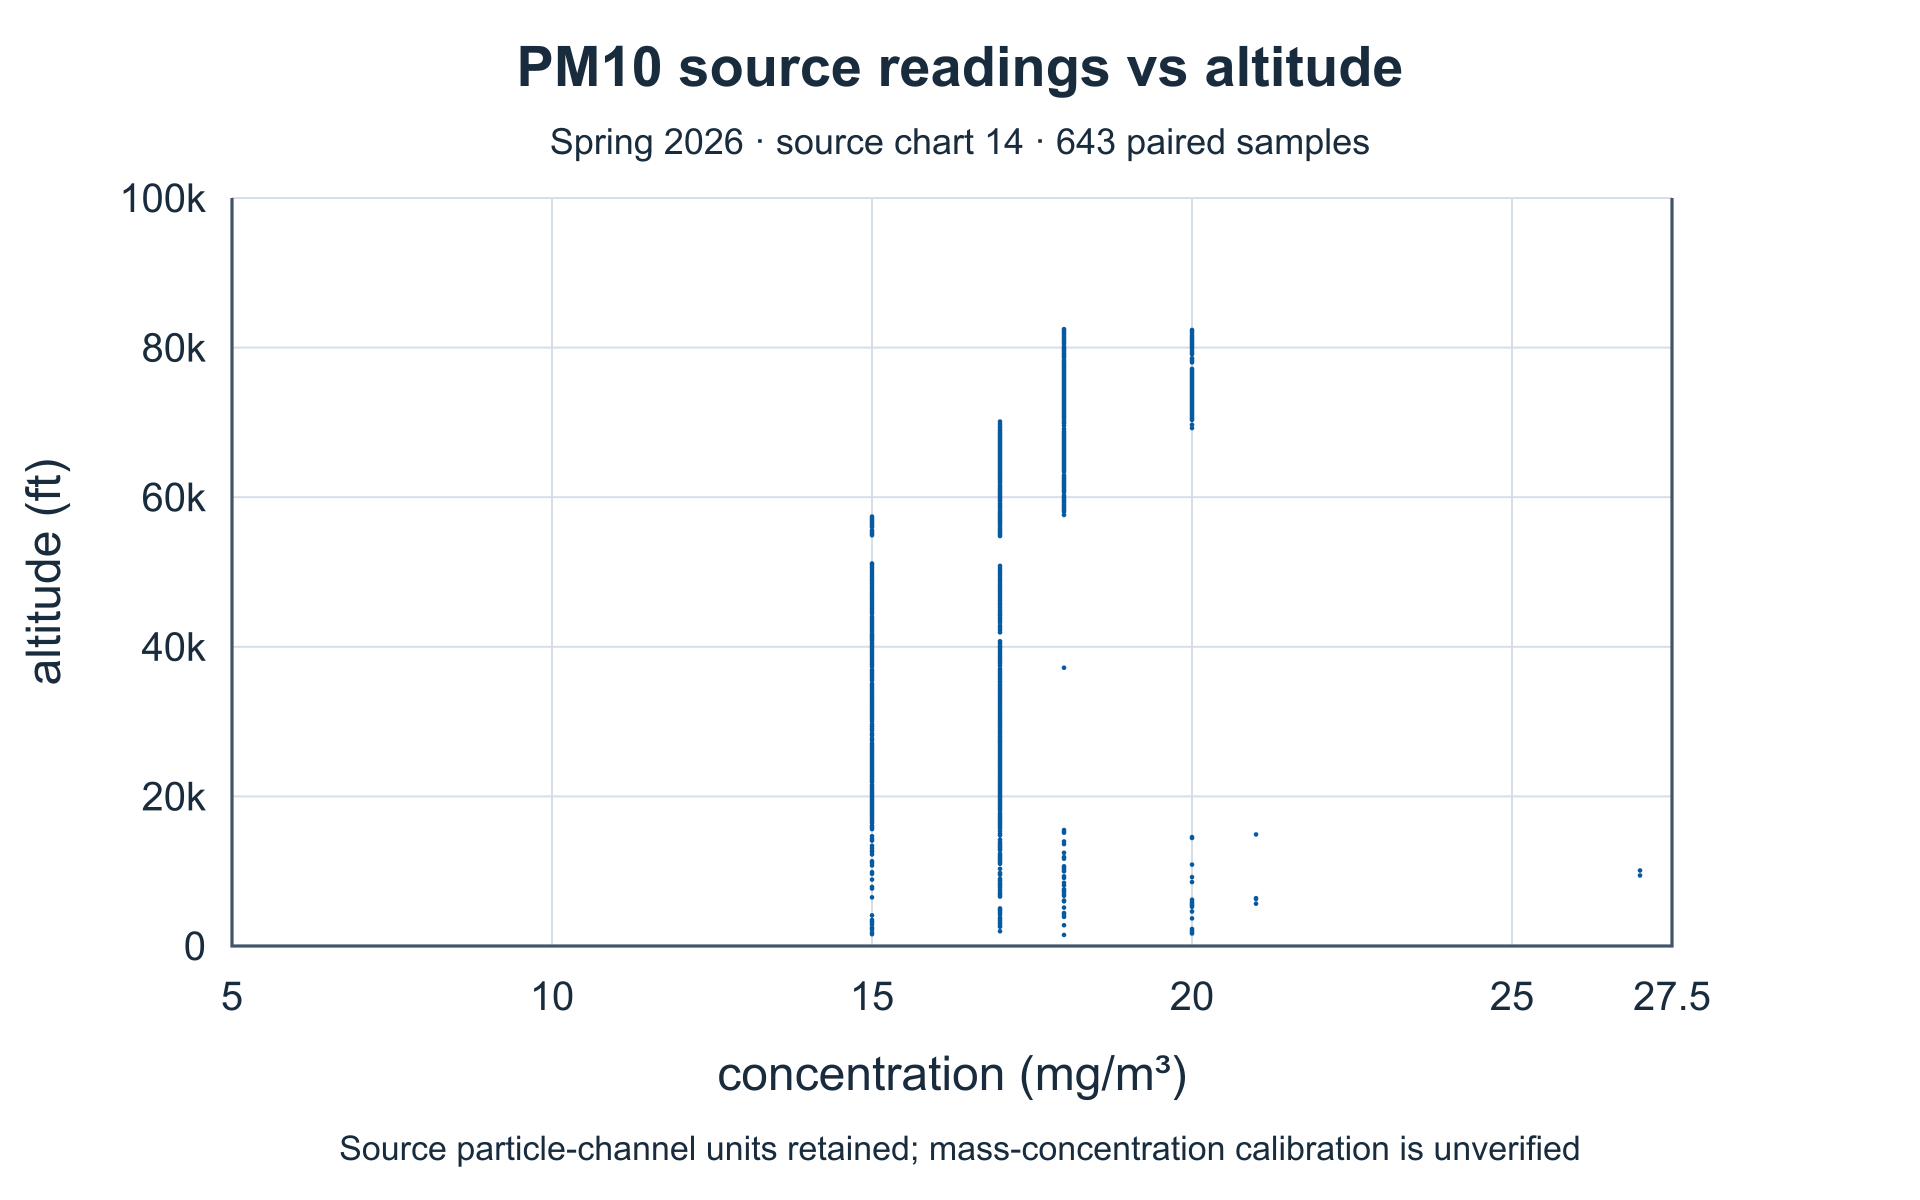
Particulate channel PM10 versus altitude
The source labels mg/m³. Units and calibration are not independently established and differ from Fall 2025’s µg/m³. No cross-year concentration comparison is claimed.
Spring 2026 acquired-data report · chart 14. Rendered from retained report values; raw series remain private. Horizontal: source channel (mg/m³ as labeled). Vertical: report altitude (ft).
Enlarge figure →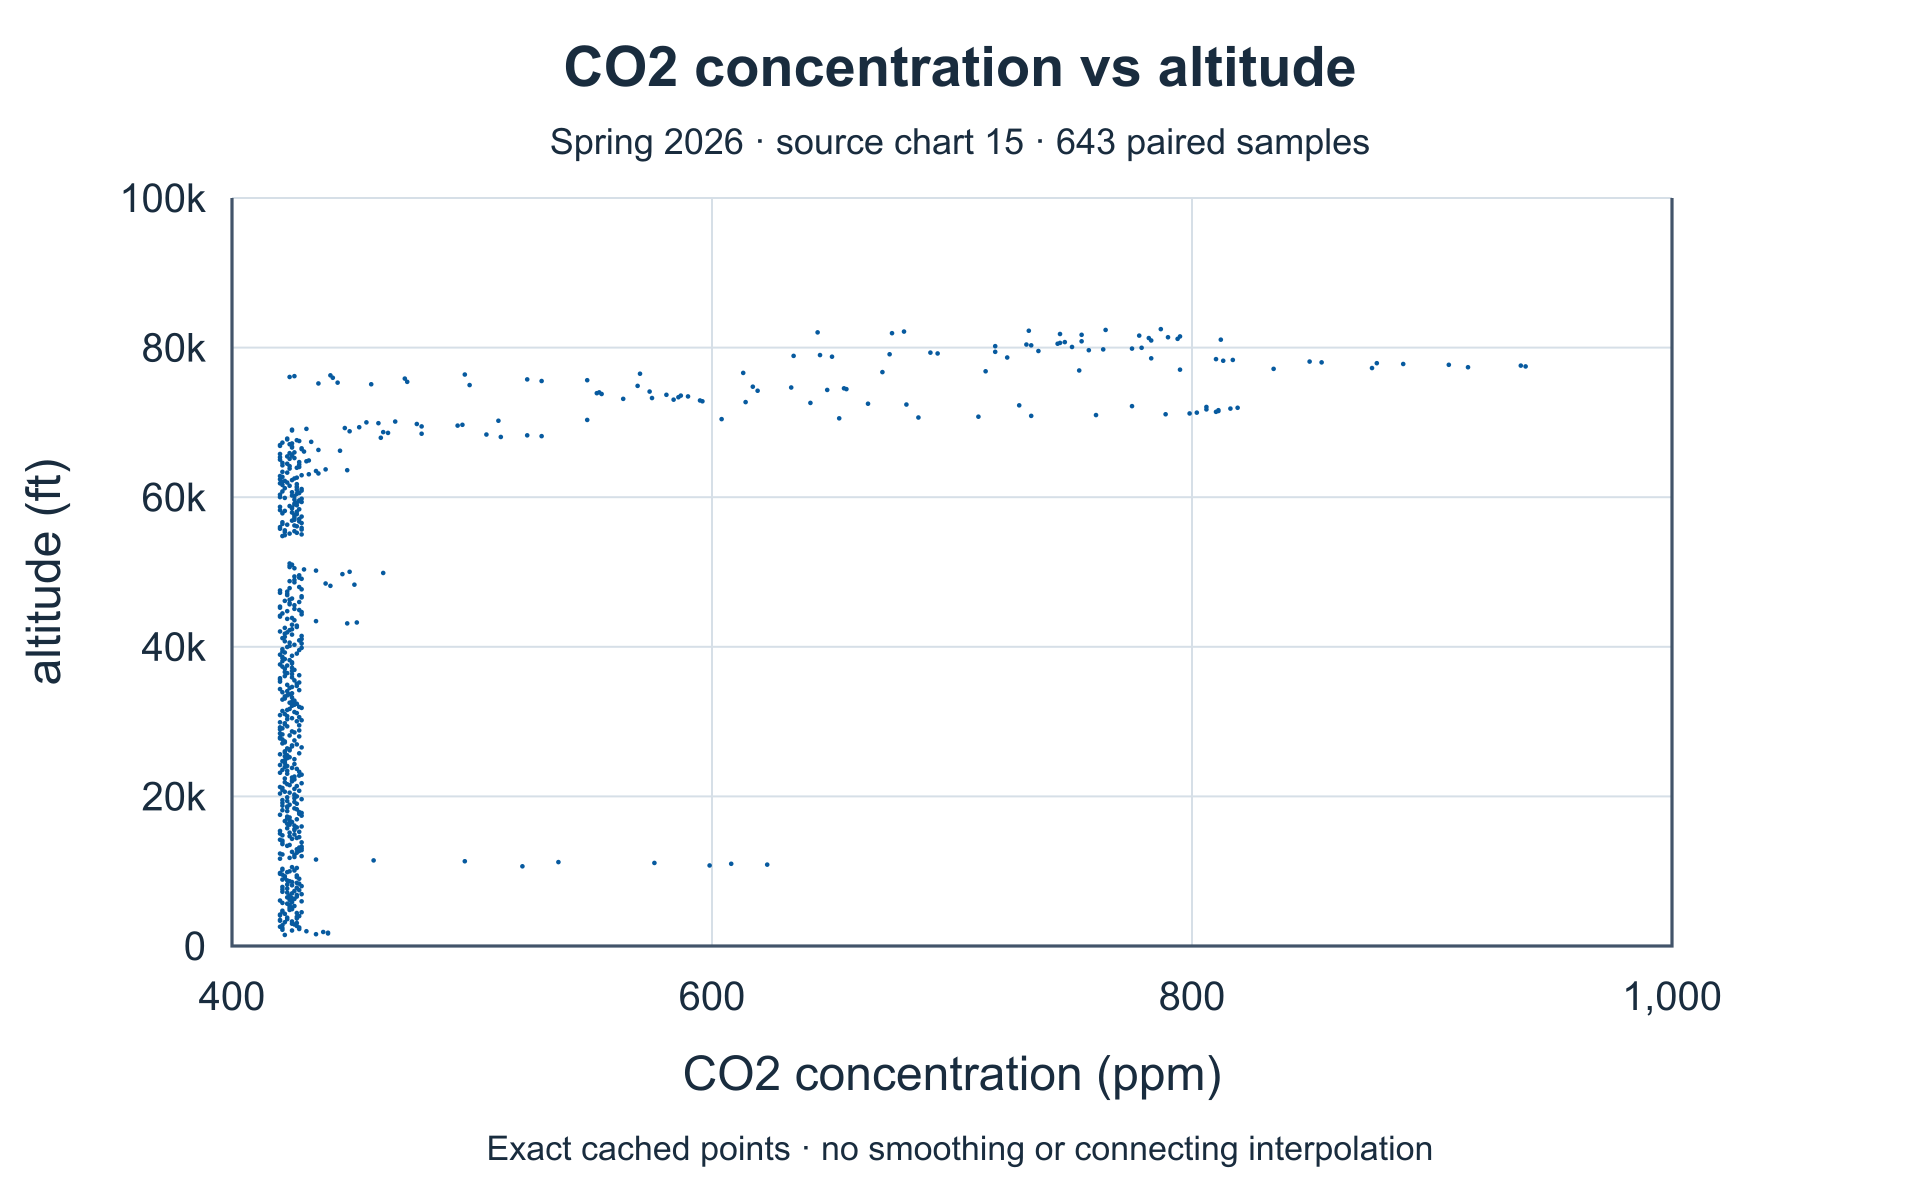
CO₂ channel versus altitude
Retained chart values peak at 939 ppm near 77,483 ft, with an earlier peak of 623 ppm near 10,879 ft. These are reported sensor readings; pressure compensation and calibration are not established. Altitude association does not establish cause.
Spring 2026 acquired-data report · chart 15. Rendered from retained report values; raw series remain private. Horizontal: CO₂ (ppm). Vertical: report altitude (ft).
Enlarge figure →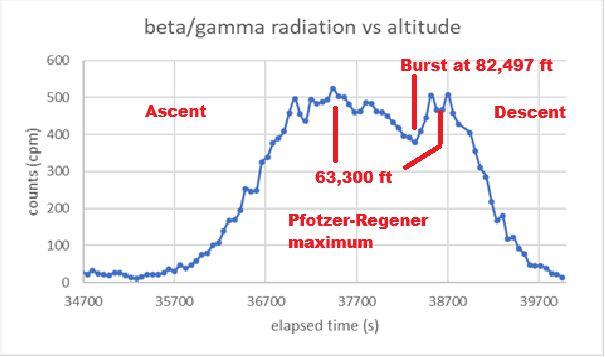
Radiation profile on the recorder clock
Although the source title says “versus altitude,” its horizontal axis is recorder time in seconds. Annotations identify a profile maximum near 63,300 ft and burst at 82,497 ft. Counts per minute are not a radiation dose.
Spring 2026 acquired-data report · original embedded figure 8. Original marks and axes retained.
Enlarge figure →Source notes that matter.
- The first three native chart caches contain Fall 2025 values. This page uses the correct Spring 2026 authored image overlays instead.
- Recorders use different clocks and altitude channels. Independent peaks are not time-aligned observations.
- Signed “windspeed” calculations are not shown as physical speed magnitudes because their sign convention is unestablished.
Source: team-supplied “Spring 2026 launch acquired data” report and photographed presentation boards. Student research, not independent instrument certification. Detector counts are not dose; channel output is not automatically calibrated concentration or irradiance.
Scientific context: NASA atmospheric radiation research · NOAA ultraviolet radiation background. Context does not validate these instruments.