Spring 2026
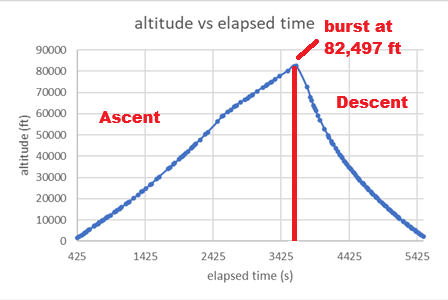
20 figures · The latest launch through the graphs and images in the team’s acquired-data report. Flight events, atmospheric channels and detector counts stay in their original measurement scopes.
Explore the research record → ASCENDStudent flight researchPhoenix College
The evidence / semester research
The actual graphs and camera images from the team’s acquired-data reports. Dates, axes, source disagreements and instrument limits stay with each figure. Original documents and raw datasets remain private.
20 figures · The latest launch through the graphs and images in the team’s acquired-data report. Flight events, atmospheric channels and detector counts stay in their original measurement scopes.
Explore the research record →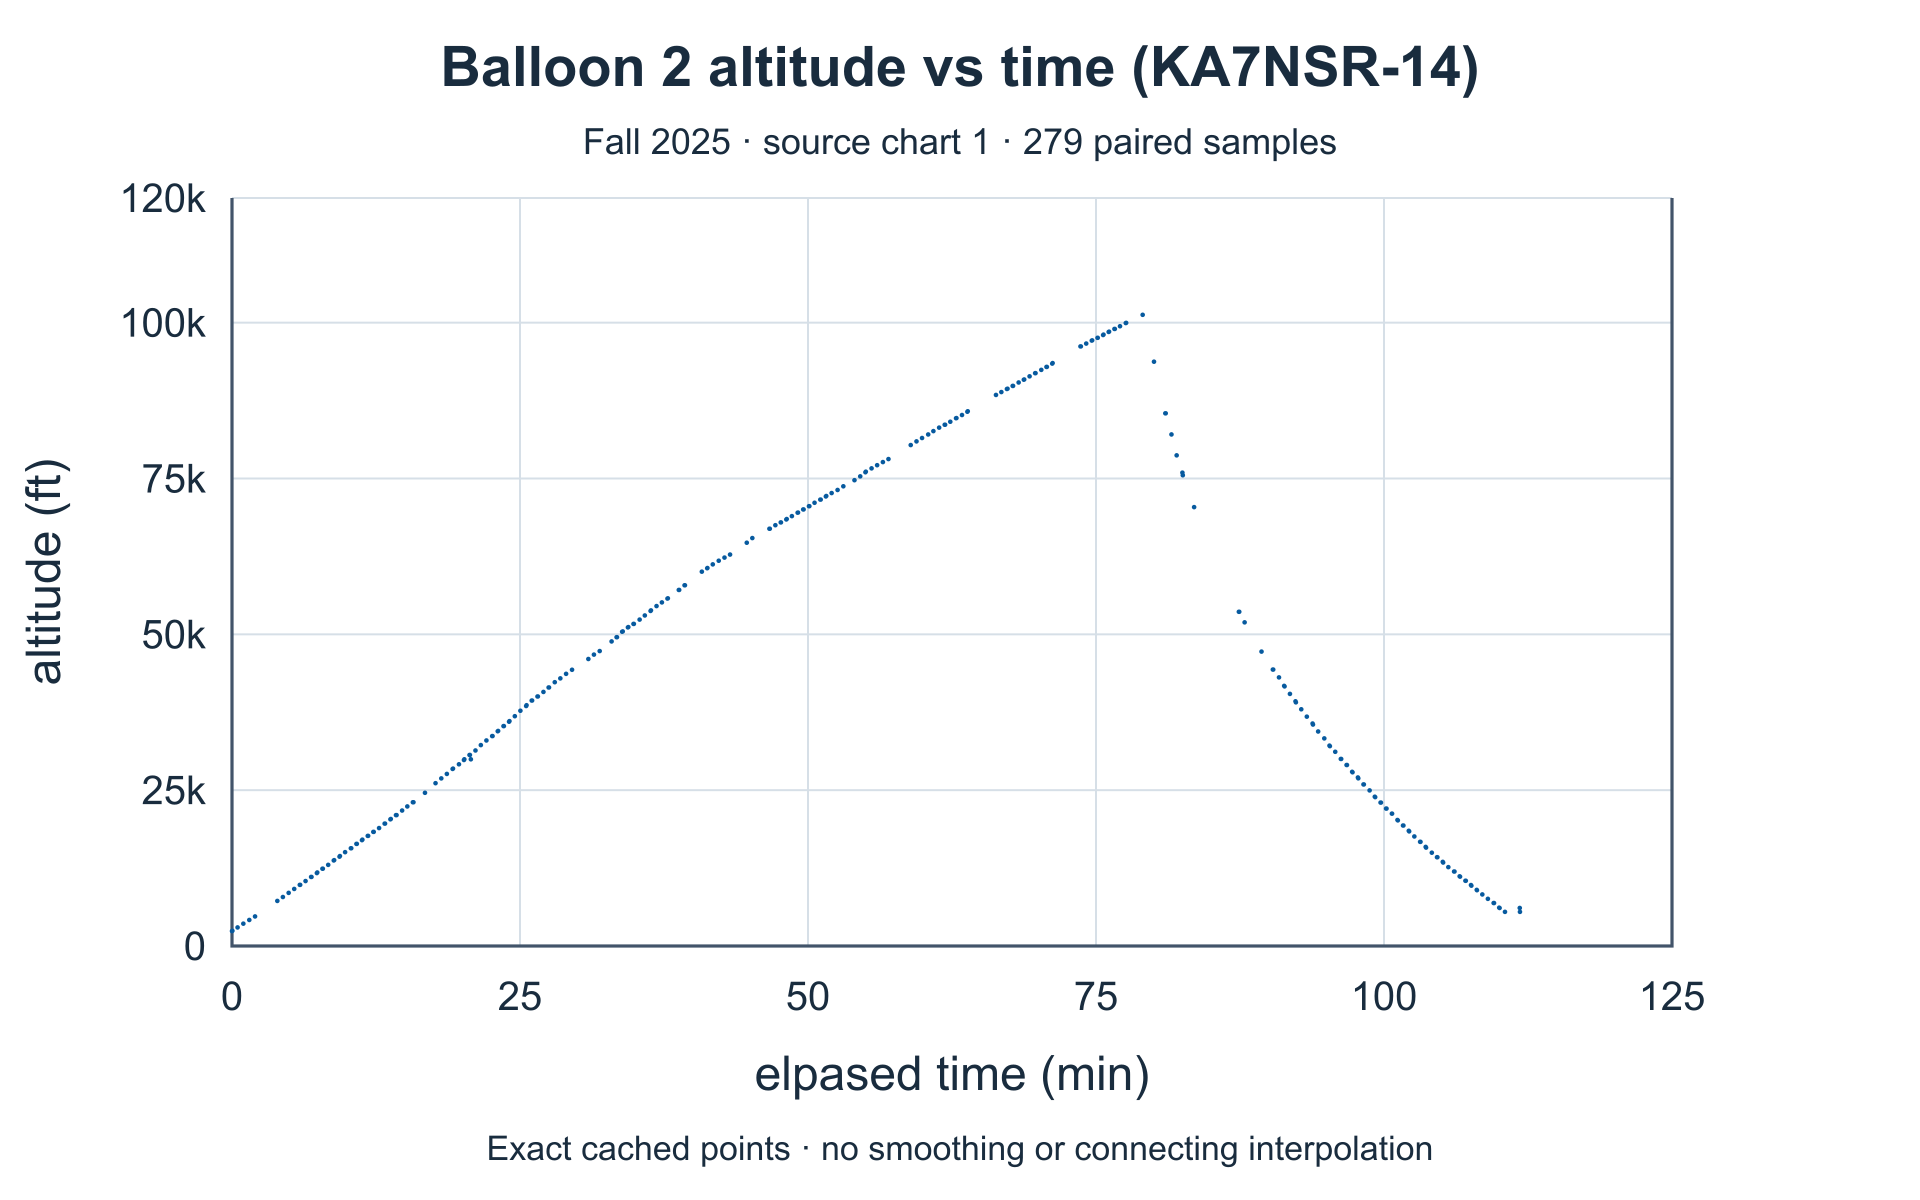
15 figures · Flight dynamics, atmospheric profiles and particulate and CO₂ channels from the team’s Fall 2025 report. Each figure retains its actual axes, units and coverage.
Explore the research record →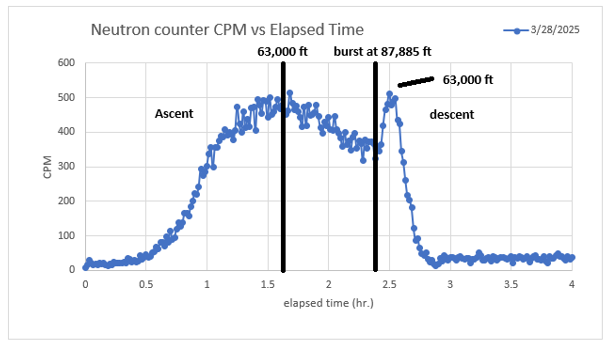
6 figures · Original graphs for temperature, UV response and the modified radiation counter. Image-only graphs stay image-only: no invented points, smoothing or re-digitized curves.
Explore the research record →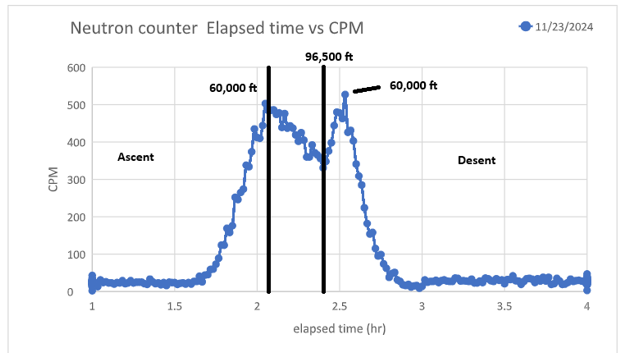
1 figure · The dated November 23, 2024 modified-counter graph from the team’s documents. Elapsed-time plots and altitude annotations are retained without borrowing later atmospheric figures.
Explore the research record →Source reports are supplied by the ASCEND team. Findings shown here are not independent instrument certification. The proposal workbench below is separate from these flight results.
STEM field guide / Read a flight like a scientist
Use the team's own figures to practice reading evidence. These examples explain the published plots; they do not add new measurements.
The Spring 2025 UV plots put altitude on the horizontal axis and relative intensity on the vertical axis. The radiation plot instead puts elapsed hours on the horizontal axis and counts per minute on the vertical axis. An altitude annotation does not change a time axis.
Inspect the UVA axes →The Spring 2023 board reports a flight maximum of 101,498 ft and a radiation-profile maximum near 69,000 ft. The highest point of the flight is not necessarily where a sensor's largest response occurs.
Read the original 2023 board →The Fall 2025 particulate and CO₂ series cover the first 28 minutes, up to about 41,407 ft—not the whole 101,260-ft flight. A blank high-altitude region is missing coverage, not a measured zero.
Check the Fall 2025 coverage notes →The Spring 2026 report records CO₂ peaks at different altitudes. A peak alone does not identify its cause. A follow-up needs a checked sensor, its temperature and pressure conditions, and repeat flights before attributing the signal to a particular source.
Inspect the Spring 2026 observations →Compare matching instruments, units and observation windows. The 2025 and 2026 particulate figures carry different source unit labels; this archive does not silently convert them into a cross-year trend.
Earlier research / Different evidence, clearly labeled
UV/DNA investigation goals, component choices and symposium presenters. Design intent is kept separate from measured flight outcomes.
Explore the 2021 design record →The payload's systems record, student team and published launch trailer. No unavailable numerical flight series is reconstructed.
Explore the 2022 systems record →The team's photographed presentation board, flight-performance annotations, radiation finding and original group photo with mentor-supplied names.
Explore the 2023 research board →Visit Teams & mentors for the annual photographs and member lists, or Mission playback for the available recorded excerpts.
ASCEND / Research & test planning
Start with something the payload can actually measure. Define what could disprove your idea, keep the raw evidence, and make the next team's analysis reproducible.
Investigation library
Proposals · not flight resultsCompare detector counts at matched altitude intervals across ascent, descent and later flights. Control integration time, geometry and instrument configuration before treating a repeated shape as a finding.
Evidence: raw counts + integration windows + synchronized altitude.
Read the Spring 2026 figures →Test whether clock alignment, the pressure model, or instrument calibration explains a discrepancy. Compare time-matched samples—not independent maxima from different instruments.
Evidence: raw pressure + GPS altitude + clock and calibration records.
Read the measurement notes →Evaluate a revised printed mount, PCB layout or composite enclosure as an engineering change. Check mass, power, sensor bias and environmental performance against the team's agreed requirements.
Evidence: configuration history + bench measurements + controlled comparisons.
Open the mass & energy model →Experiment brief / local workbench
Choose a starting point, replace its assumptions, and define your own acceptance criteria. The brief is a proposal for faculty and team review—not permission to fly or a safety certification.
Your draft stays in this browser tab. It is not submitted or automatically saved. Download it before leaving or reloading. Keep personal information and private team records out of the brief.
Loading a starting point replaces your current draft. Download any work you want to keep first.
Before the design review
Preserve raw files. Version the analysis and instrument configuration. Label every derived quantity and make unit conversions explicit.
A similar curve does not prove the same cause. A detector count rate is not automatically a dose estimate. A workbook annotation is not an independently verified event.
“Lighter” needs a comparable mass measurement. “More efficient” needs an energy budget and test conditions. “Flight-ready” needs the responsible team's review.
The handbook is a systems-engineering reference, not a claim that these student proposals meet NASA certification requirements.