
Phoenix College NASA ASCEND / Spring 2025
Spring 2025
research record.
Original graphs for temperature, UV response and the modified radiation counter. Image-only graphs stay image-only: no invented points, smoothing or re-digitized curves.
- Annotated burst altitude
- 87,885 ft Spring 2025 counter figure
- Profile maximum
- ≈ 63,000 ft Altitude annotation; x-axis is time
- UV measurements
- Relative intensity Independent source scales
Presentation figures are public. Original research documents, raw measurements, analysis files and source repositories are not provided as downloads.
Source-backed presentation
Read the actual evidence.
Every graph keeps its complete axes. Select a subject or enlarge a figure to read the labels. No smoothed replacement curves or invented observations.
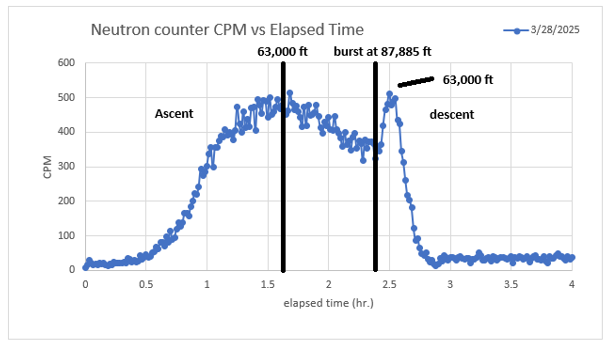
Modified counter: Spring 2025
The legend reads 3/28/2025; the poster’s flight table reads 3/29/2025. It marks 87,885 ft burst and profile maxima near 63,000 ft. Horizontal: elapsed hours. Vertical: CPM.
Spring 2025 acquired-data report · original embedded figure 7. Original marks and axes retained.
Enlarge figure →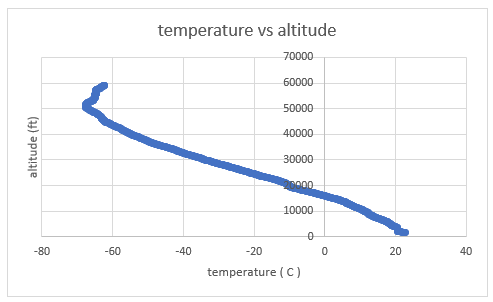
External temperature versus altitude
The original profile is preserved. Narrative rounds the minimum to about −60 °C; the plotted curve extends below −60 °C. No precise minimum is inferred by digitizing the image.
Spring 2025 acquired-data report · original embedded figure 1. Original marks and axes retained.
Enlarge figure →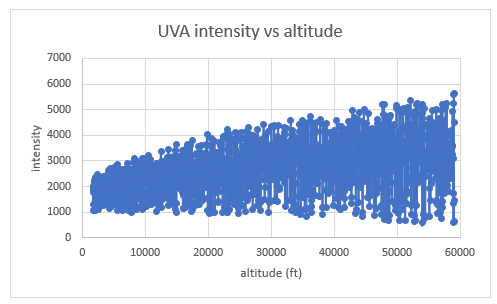
UVA relative intensity versus altitude
Horizontal: altitude in feet. Vertical: relative intensity. The broad range at each altitude is preserved, rather than replaced by a smooth trend. UVA uses its own intensity scale; these values are not established here as calibrated irradiance.
Spring 2025 acquired-data report · original embedded figure 2. Original marks and axes retained.
Enlarge figure →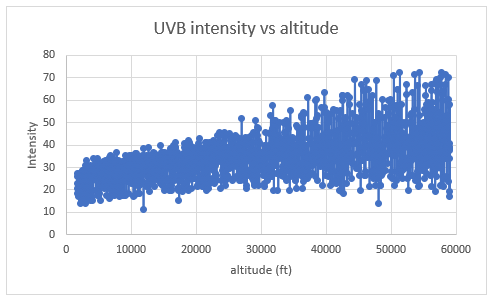
UVB relative intensity versus altitude
Horizontal: altitude in feet. Vertical: relative intensity. Read the UVB scale separately from UVA: a taller plotted trace is not automatically a larger physical irradiance when the axes use different ranges.
Spring 2025 acquired-data report · original embedded figure 3. Original marks and axes retained.
Enlarge figure →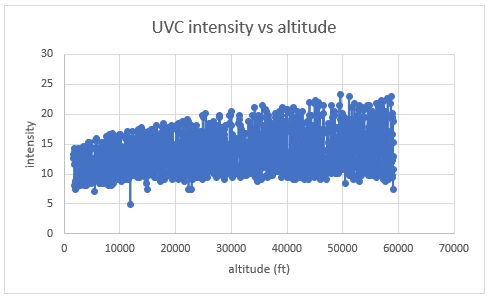
UVC relative intensity versus altitude
Horizontal: altitude in feet. Vertical: relative intensity. UVC uses its own scale. This is the recorded channel response, not independently calibrated ambient UVC exposure; sensor spectral response and calibration must be checked before making that claim.
Spring 2025 acquired-data report · original embedded figure 4. Original marks and axes retained.
Enlarge figure →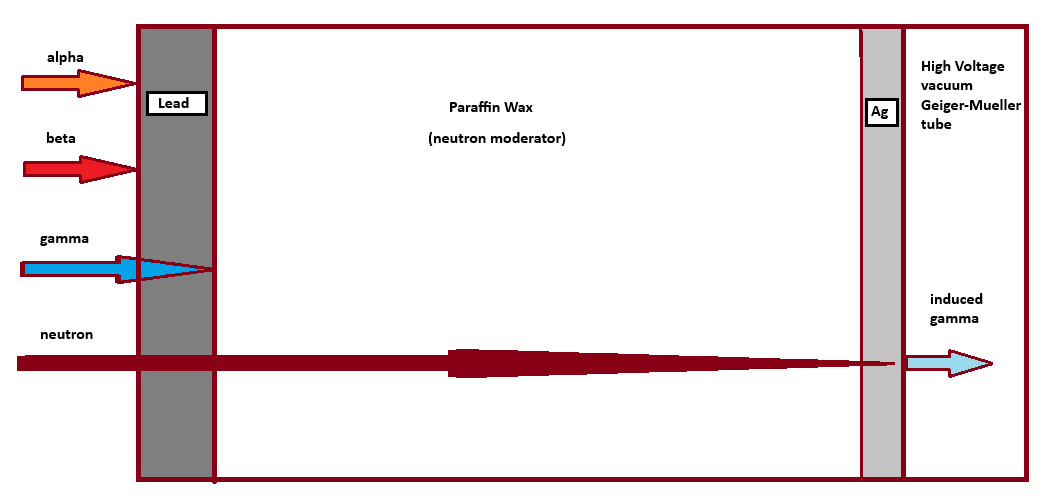
Student neutron-detection concept
Published schematic of the team’s modified-counter experiment. Counts are not calibrated neutron-only flux or dose, and this diagram does not quantitatively establish shielding performance.
Spring 2025 acquired-data report · original embedded figure 5. Original marks and axes retained.
Enlarge figure →Source notes that matter.
- The Fall 2024 and Spring 2025 documents contain the same seven images. Only the plot dated November 23, 2024 is assigned to Fall 2024.
- Spring 2025 plot legend and poster flight table disagree by one day; no exact launch date is asserted here.
- Causal explanations in source prose remain hypotheses, separate from measured profiles.
Source: team-supplied “Spring 2025 launch acquired data” report and photographed presentation boards. Student research, not independent instrument certification. Detector counts are not dose; channel output is not automatically calibrated concentration or irradiance.
Scientific context: NASA atmospheric radiation research · NOAA ultraviolet radiation background. Context does not validate these instruments.