
Phoenix College NASA ASCEND / Fall 2024
Fall 2024
research record.
The dated November 23, 2024 modified-counter graph from the team’s documents. Elapsed-time plots and altitude annotations are retained without borrowing later atmospheric figures.
- Annotated burst altitude
- 96,500 ft Dated source plot
- Profile maximum
- ≈ 60,000 ft Ascent and descent annotations
- Count-rate unit
- CPM Counts per minute; not dose
Presentation figures are public. Original research documents, raw measurements, analysis files and source repositories are not provided as downloads.
Source-backed presentation
Read the actual evidence.
Every graph keeps its complete axes. Select a subject or enlarge a figure to read the labels. No smoothed replacement curves or invented observations.
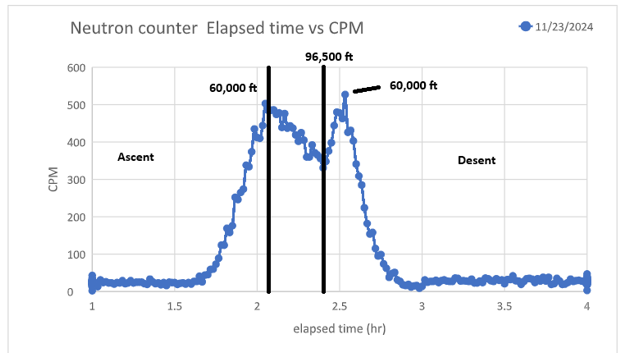
Modified counter: November 23, 2024
The 11/23/2024 legend assigns this to Fall 2024. It annotates 96,500 ft burst and profile maxima near 60,000 ft on ascent and descent. Horizontal: elapsed hours. Vertical: counts per minute.
Fall 2024 and Spring 2025 acquired-data reports · identical original figure 6. Assignment follows the dated plot, not the filename.
Enlarge figure →Source notes that matter.
- The supplied Fall 2024 document opens with Spring 2025 results and repeats its images. Assignment follows dates inside each figure.
- The horizontal axis is elapsed hours. Altitude annotations do not make it a count-versus-altitude plot.
- The modified counter also responds to other radiation. This is not calibrated neutron-only flux.
Source: team-supplied “Fall 2024 launch acquired data” report and photographed presentation boards. Student research, not independent instrument certification. Detector counts are not dose; channel output is not automatically calibrated concentration or irradiance.
Scientific context: NASA atmospheric radiation research · NOAA ultraviolet radiation background. Context does not validate these instruments.