
Phoenix College NASA ASCEND / Fall 2025
Fall 2025
research record.
Flight dynamics, atmospheric profiles and particulate and CO₂ channels from the team’s Fall 2025 report. Each figure retains its actual axes, units and coverage.
- Reported burst altitude
- 101,260 ft Chart 79.05 min; prose 77.6 min
- External temperature
- ≈ −60 °C Chart minimum −59.98 °C
- CO₂ channel peak
- 640 ppm Chart 21,874 ft; prose 21,118 ft
Presentation figures are public. Original research documents, raw measurements, analysis files and source repositories are not provided as downloads.
Source-backed presentation
Read the actual evidence.
Every graph keeps its complete axes. Select a subject or enlarge a figure to read the labels. No smoothed replacement curves or invented observations.
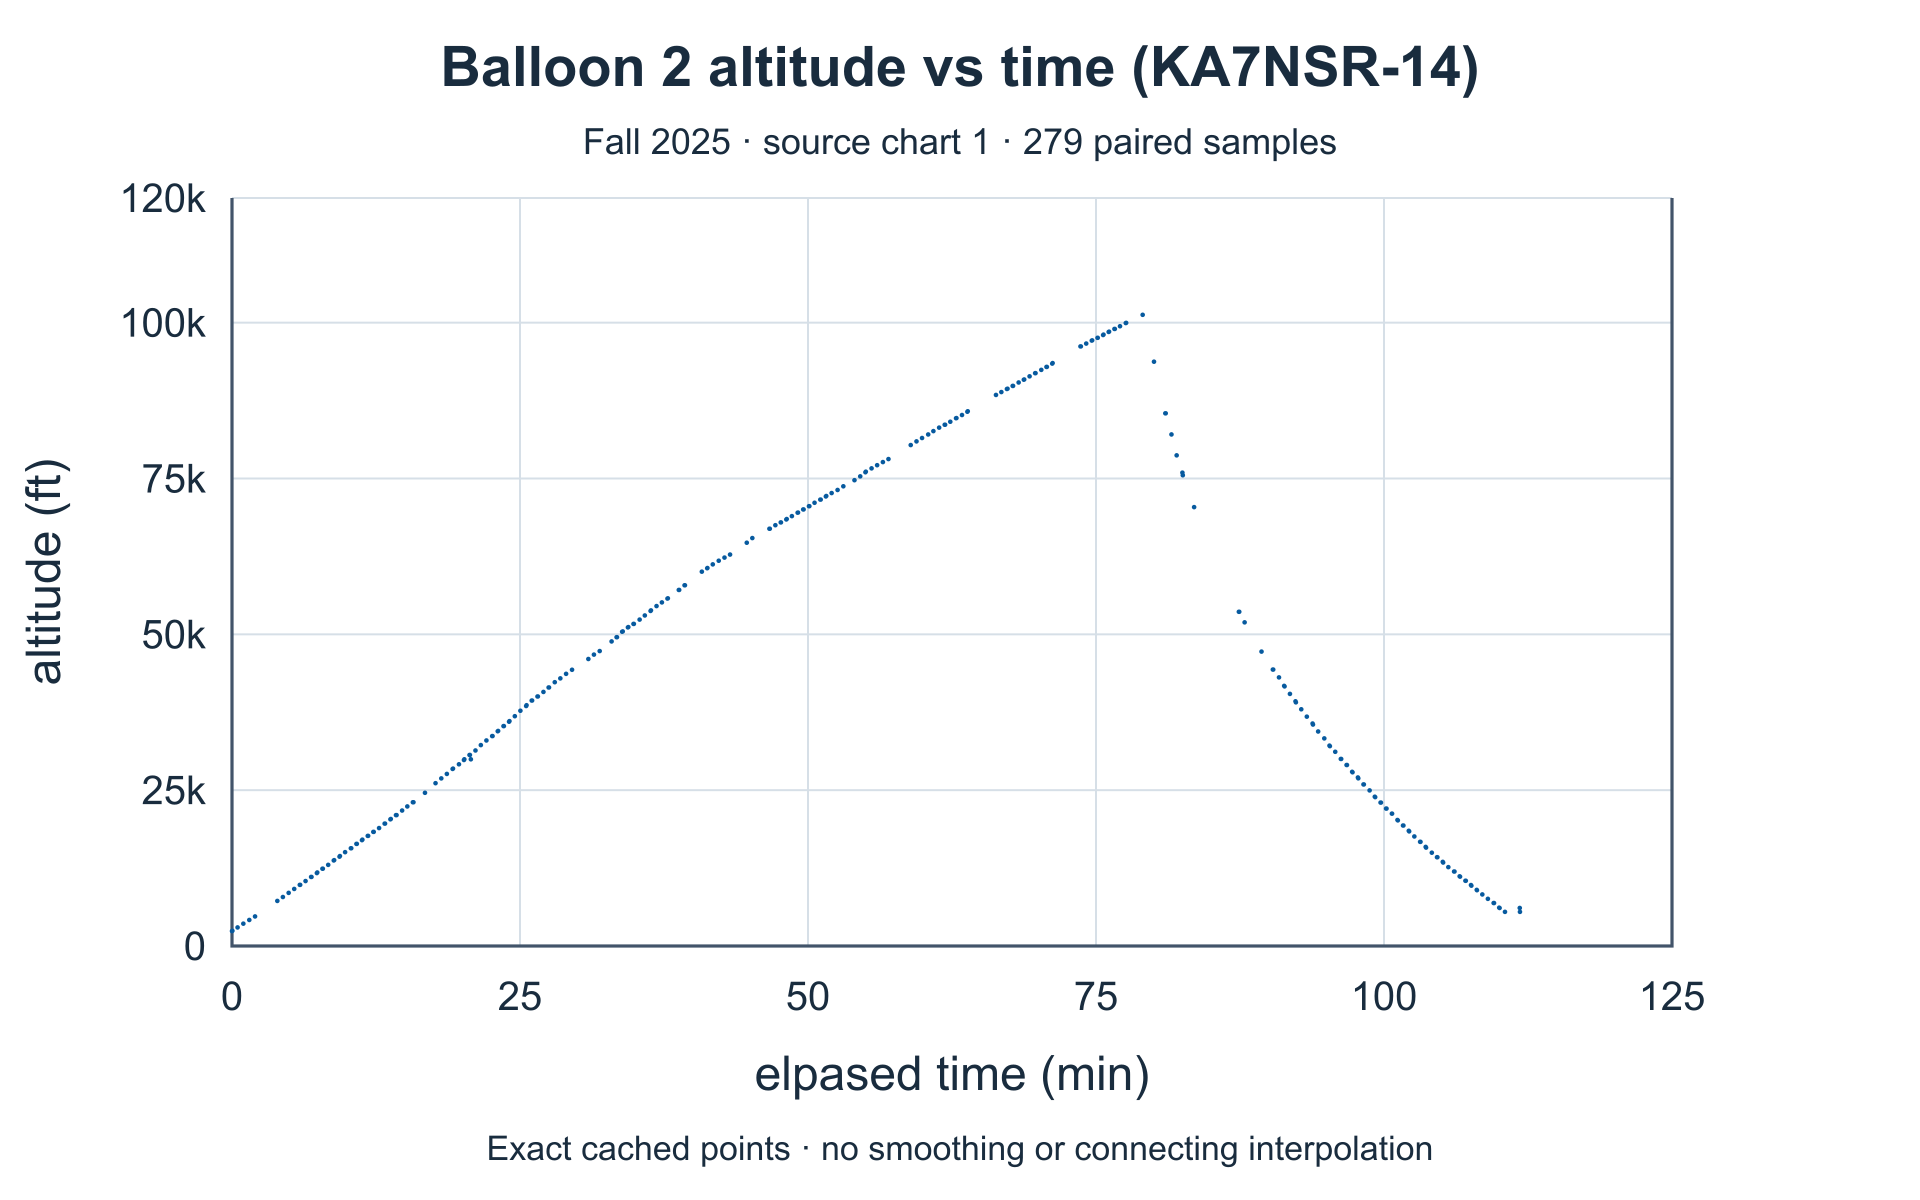
Altitude versus elapsed minutes
The chart reaches 101,260 ft at 79.05 minutes; prose gives 77.6 minutes. Their timing difference has not been silently reconciled.
Fall 2025 acquired-data report · chart 1. Rendered from retained report values; raw series remain private. Horizontal: min. Vertical: ft.
Enlarge figure →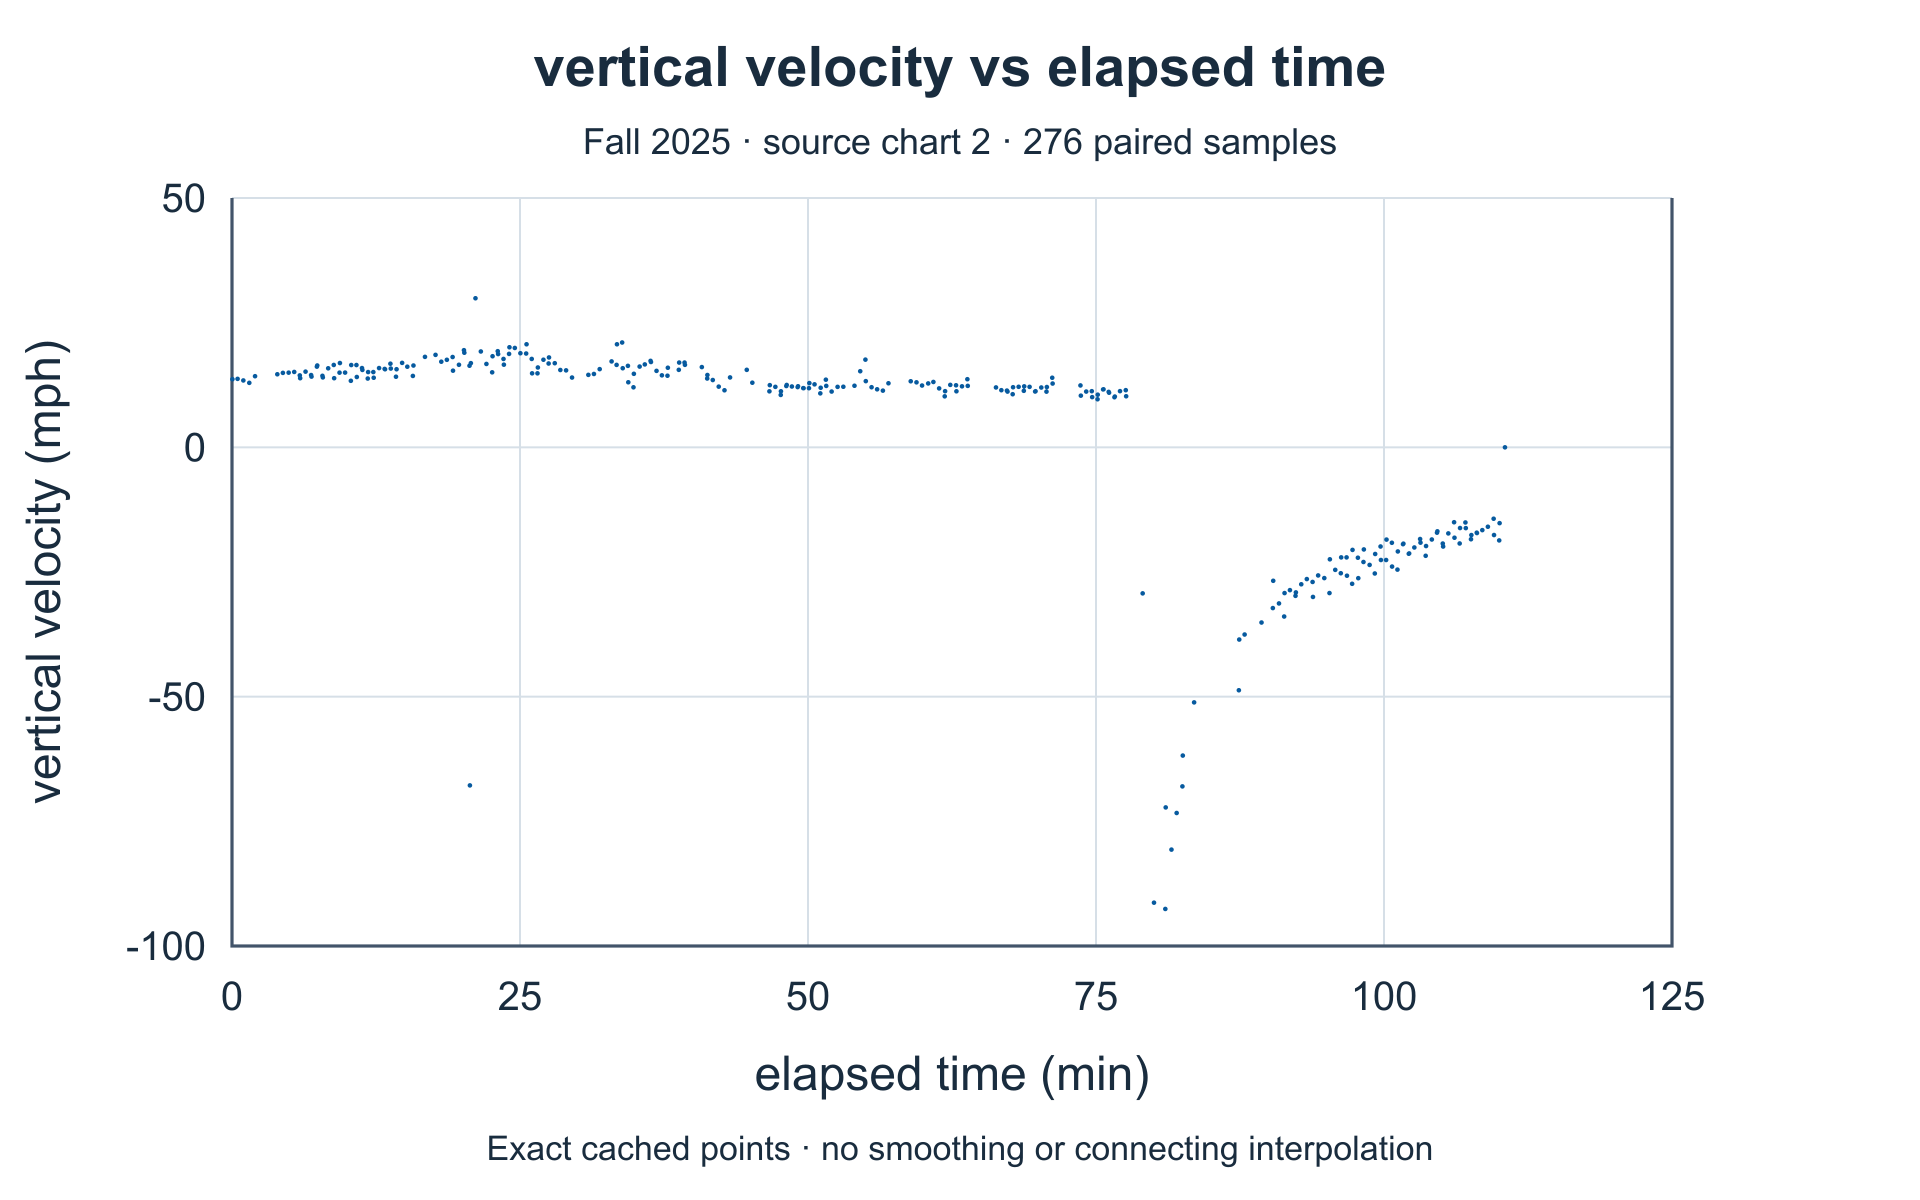
Vertical velocity versus elapsed minutes
Values reach −92.57 mph; prose states 96.2 mph maximum descent. The poster labels approximately 92 mph. This is vertical velocity, not APRS ground speed.
Fall 2025 acquired-data report · chart 2. Rendered from retained report values; raw series remain private. Horizontal: min. Vertical: mph.
Enlarge figure →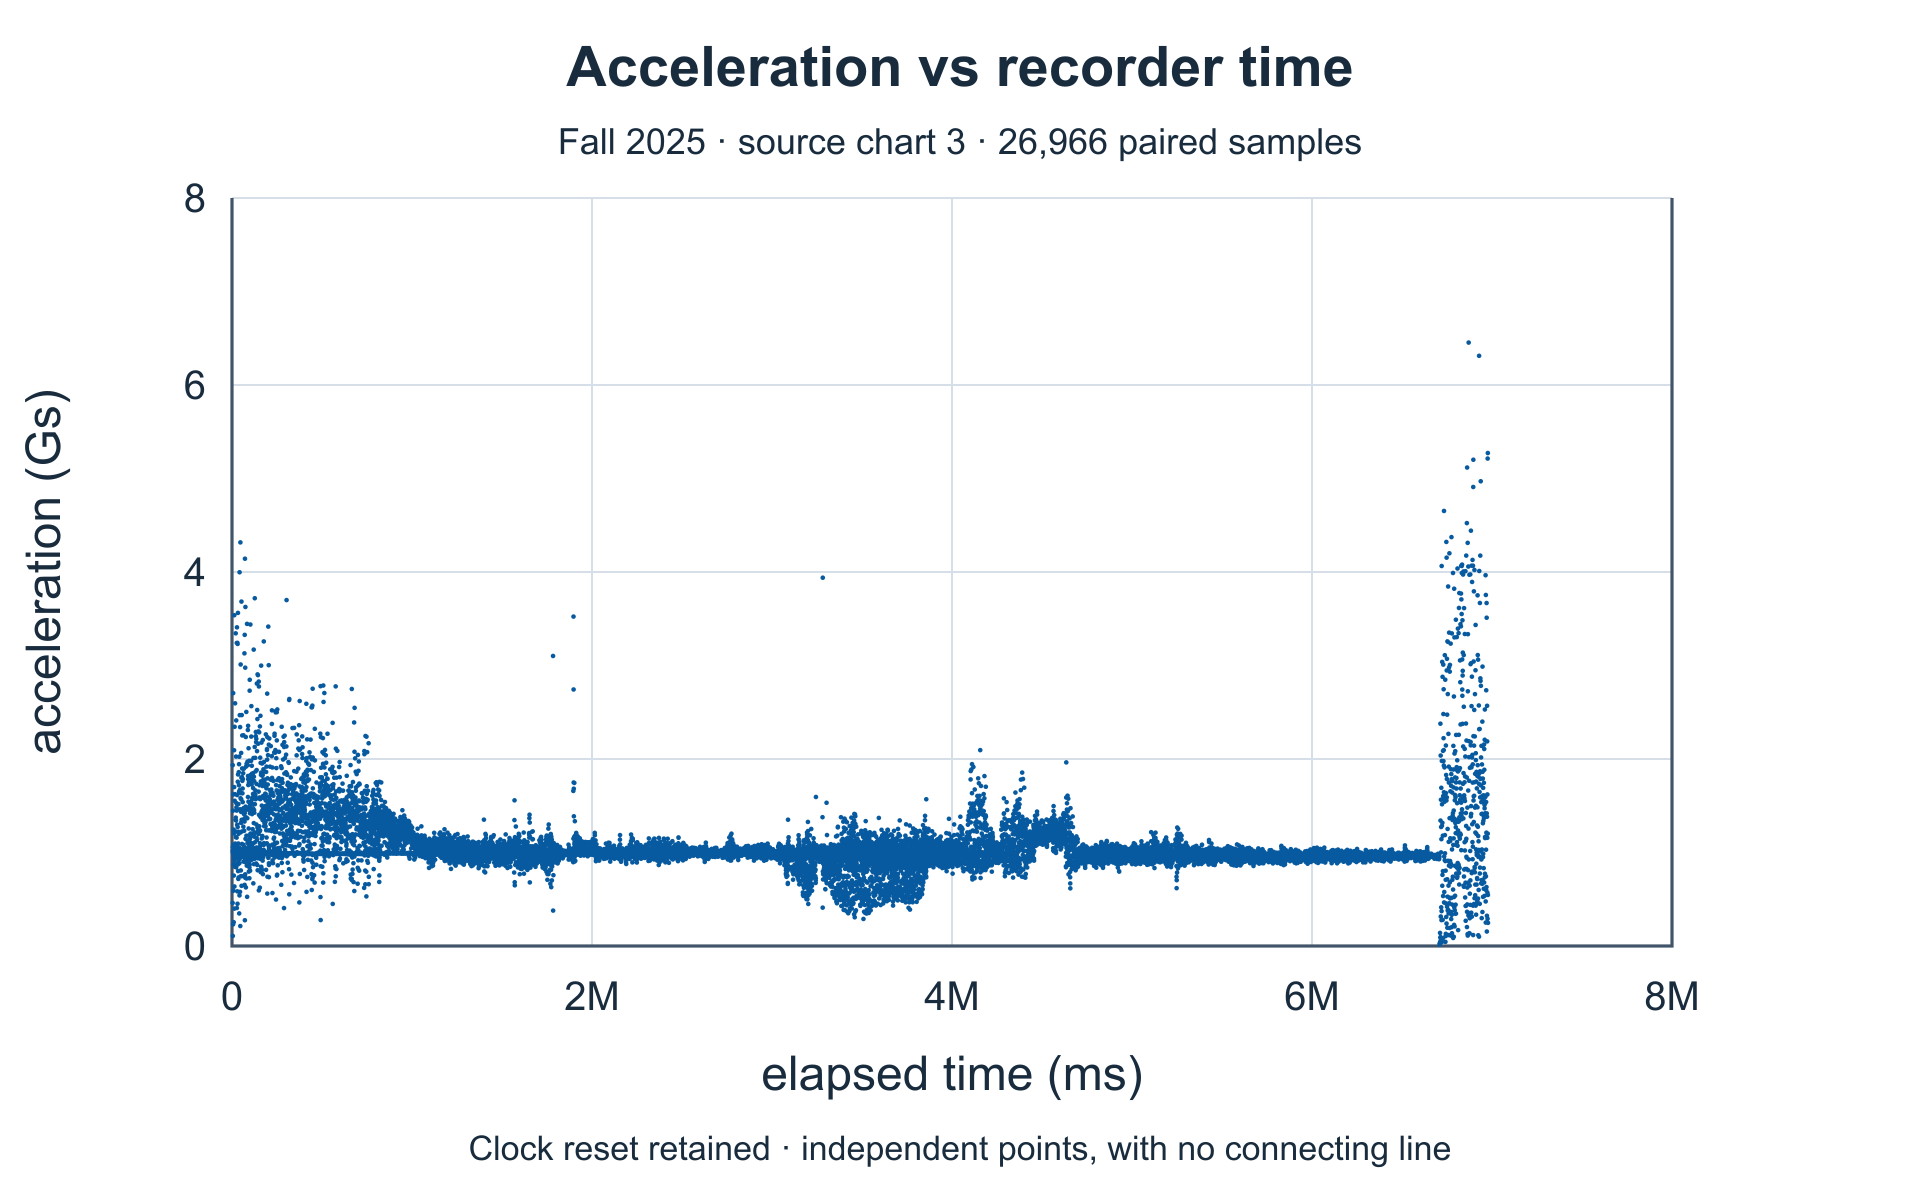
Acceleration: recorder samples
The clock resets within this series and one sample lacks paired time. Points stay unconnected; no repaired continuous timeline is implied. Source peak: about 6.45 G.
Fall 2025 acquired-data report · chart 3. Rendered from retained report values; raw series remain private. Horizontal: recorder elapsed time (ms, including reset). Vertical: G.
Enlarge figure →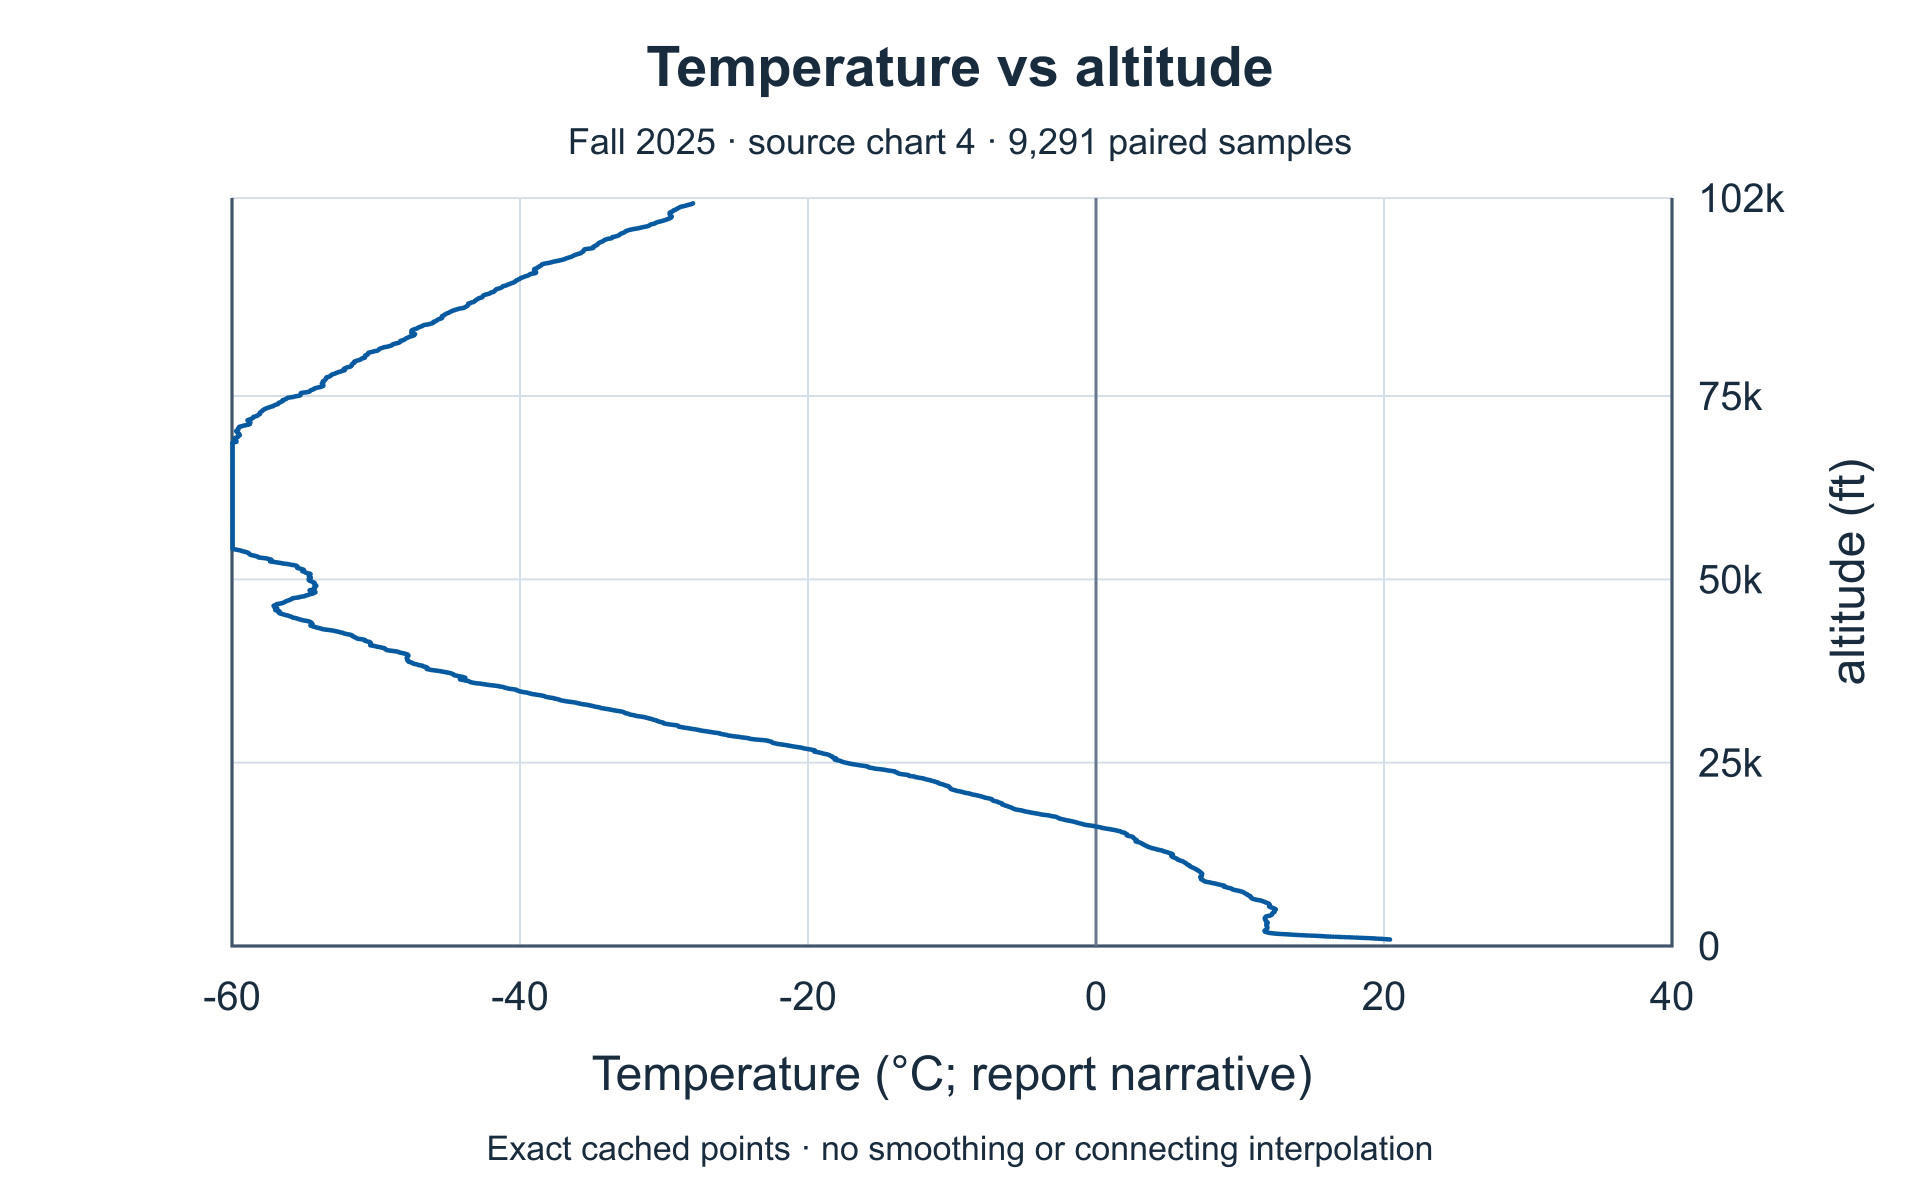
External temperature versus altitude
Minimum is approximately −59.98 °C, consistent with rounded −59.9 to −60 °C prose. Higher-altitude warming is an observation, not evidence of detector-induced heating.
Fall 2025 acquired-data report · chart 4. Rendered from retained report values; raw series remain private. Horizontal: °C. Vertical: report altitude (ft).
Enlarge figure →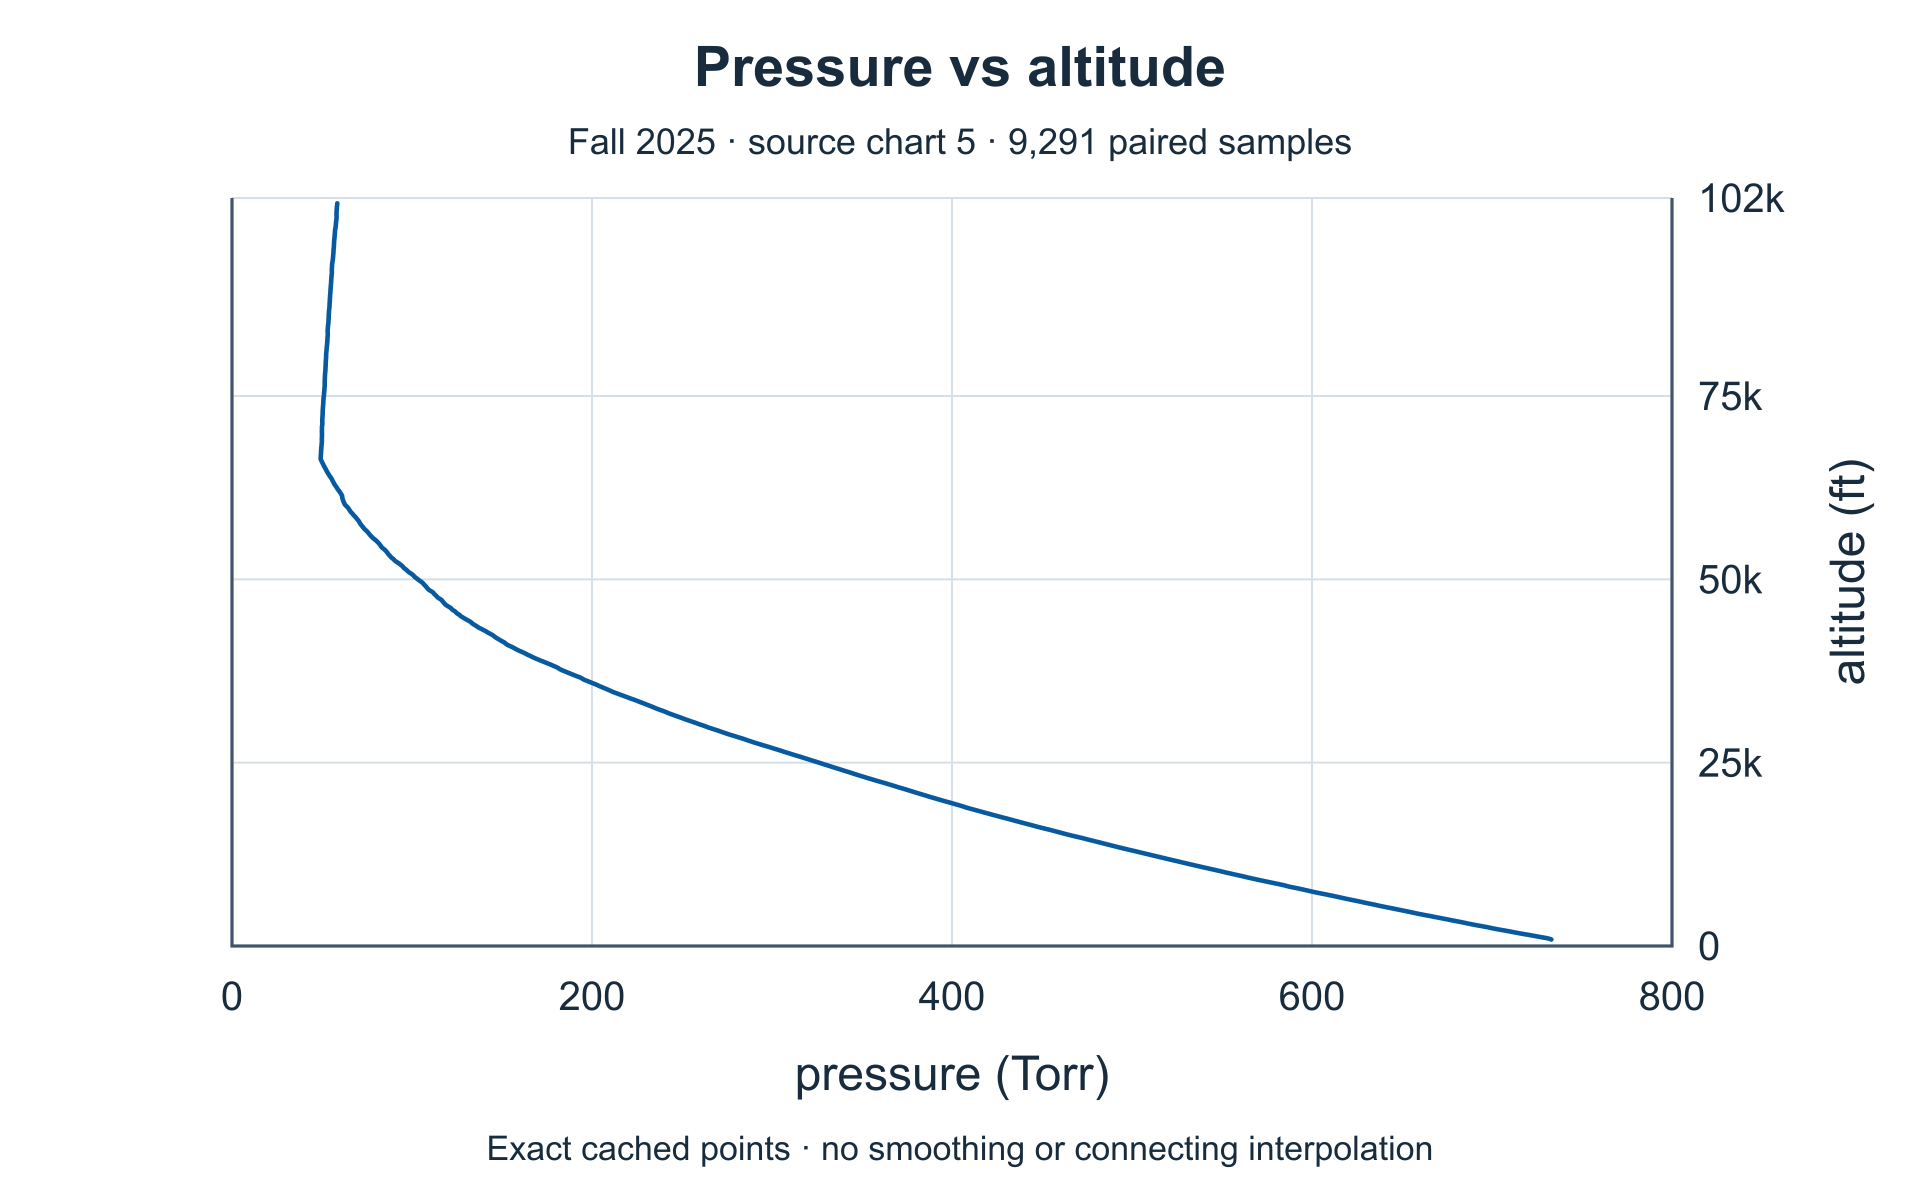
Pressure versus altitude
The chart reaches approximately 49.249 Torr; prose rounds to 49.2 Torr. Altitude is the report’s own channel.
Fall 2025 acquired-data report · chart 5. Rendered from retained report values; raw series remain private. Horizontal: Torr. Vertical: report altitude (ft).
Enlarge figure →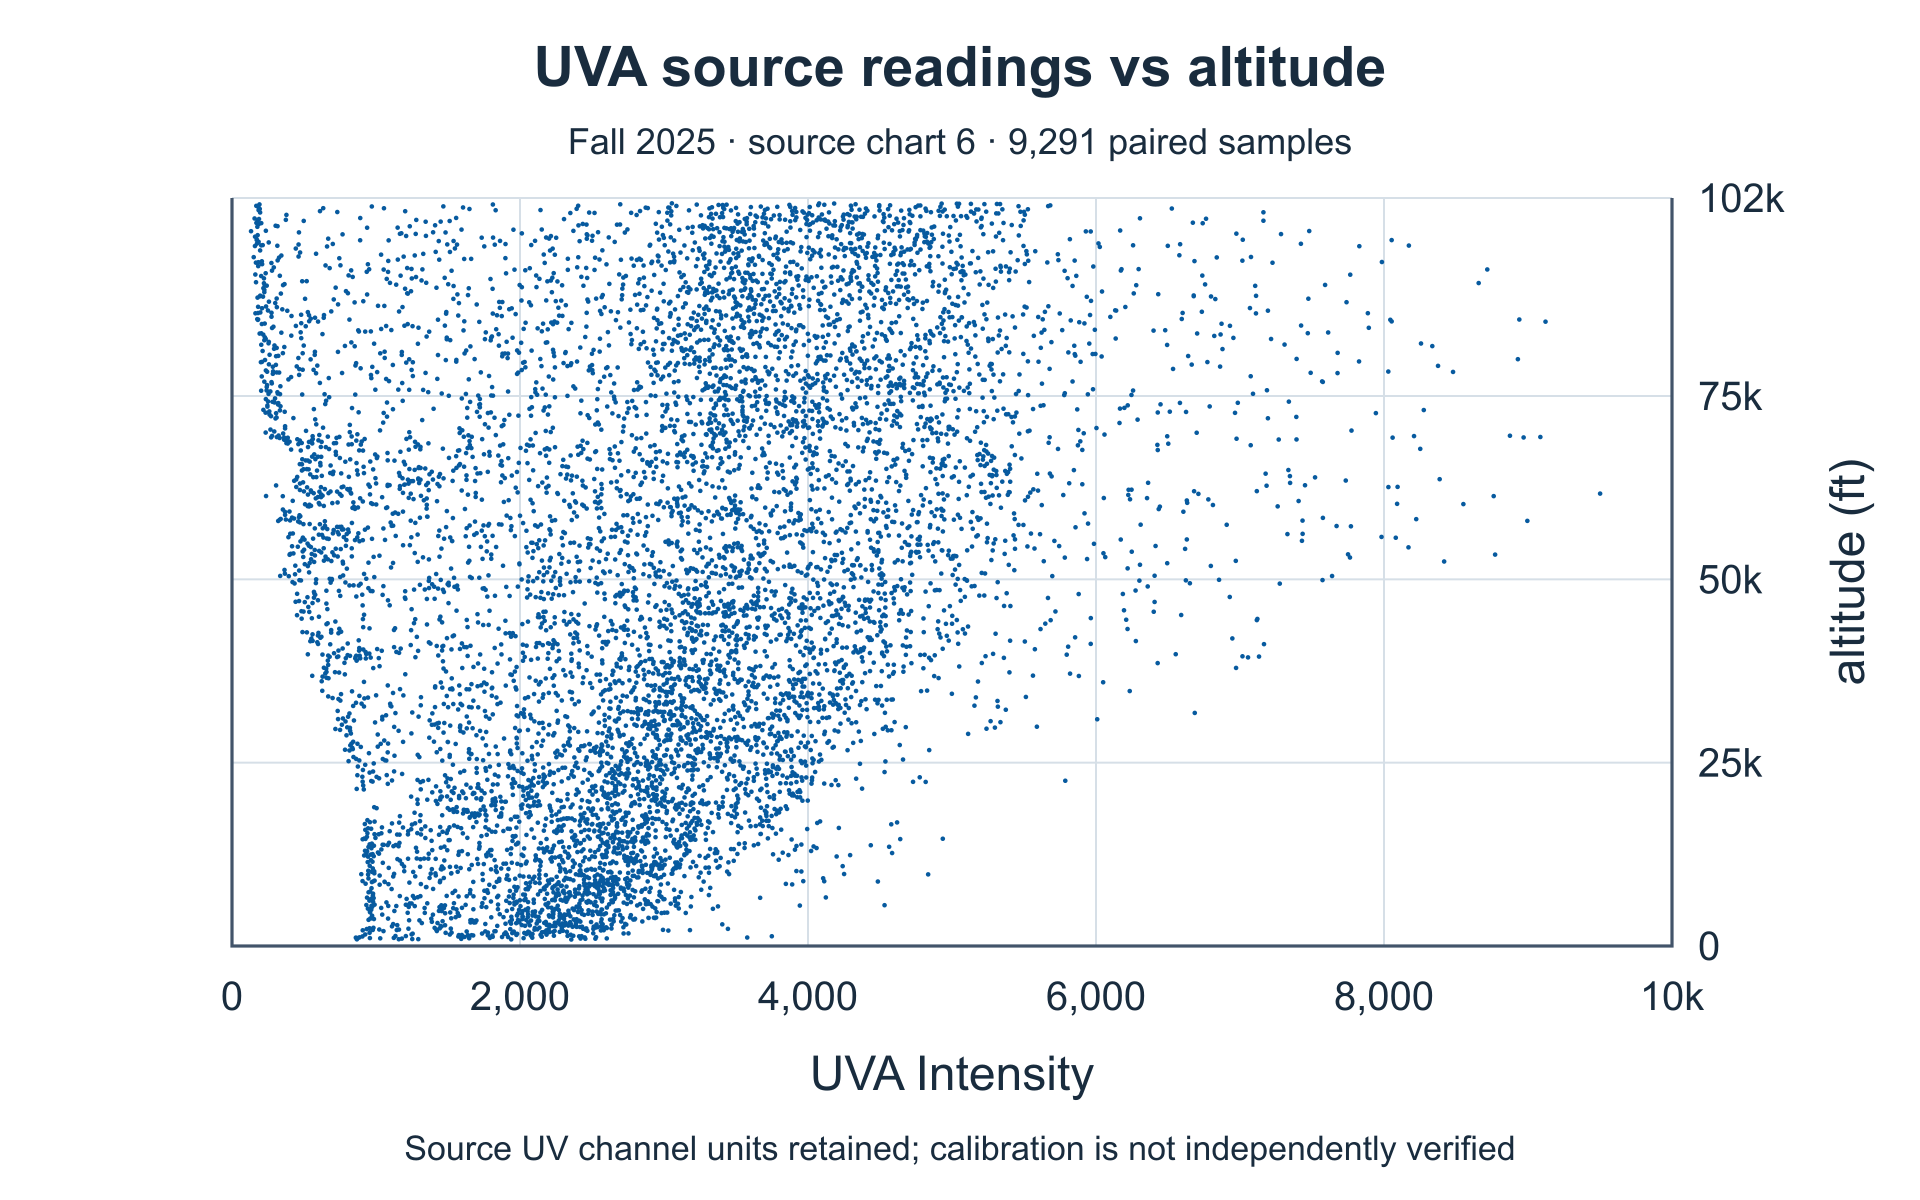
UVA channel versus altitude
The source’s independent channel scale is retained. Calibration and spectral selectivity are not established; no dose, UV-index or calibrated irradiance claim is made.
Fall 2025 acquired-data report · chart 6. Rendered from retained report values; raw series remain private. Horizontal: source UV output (units unspecified). Vertical: report altitude (ft).
Enlarge figure →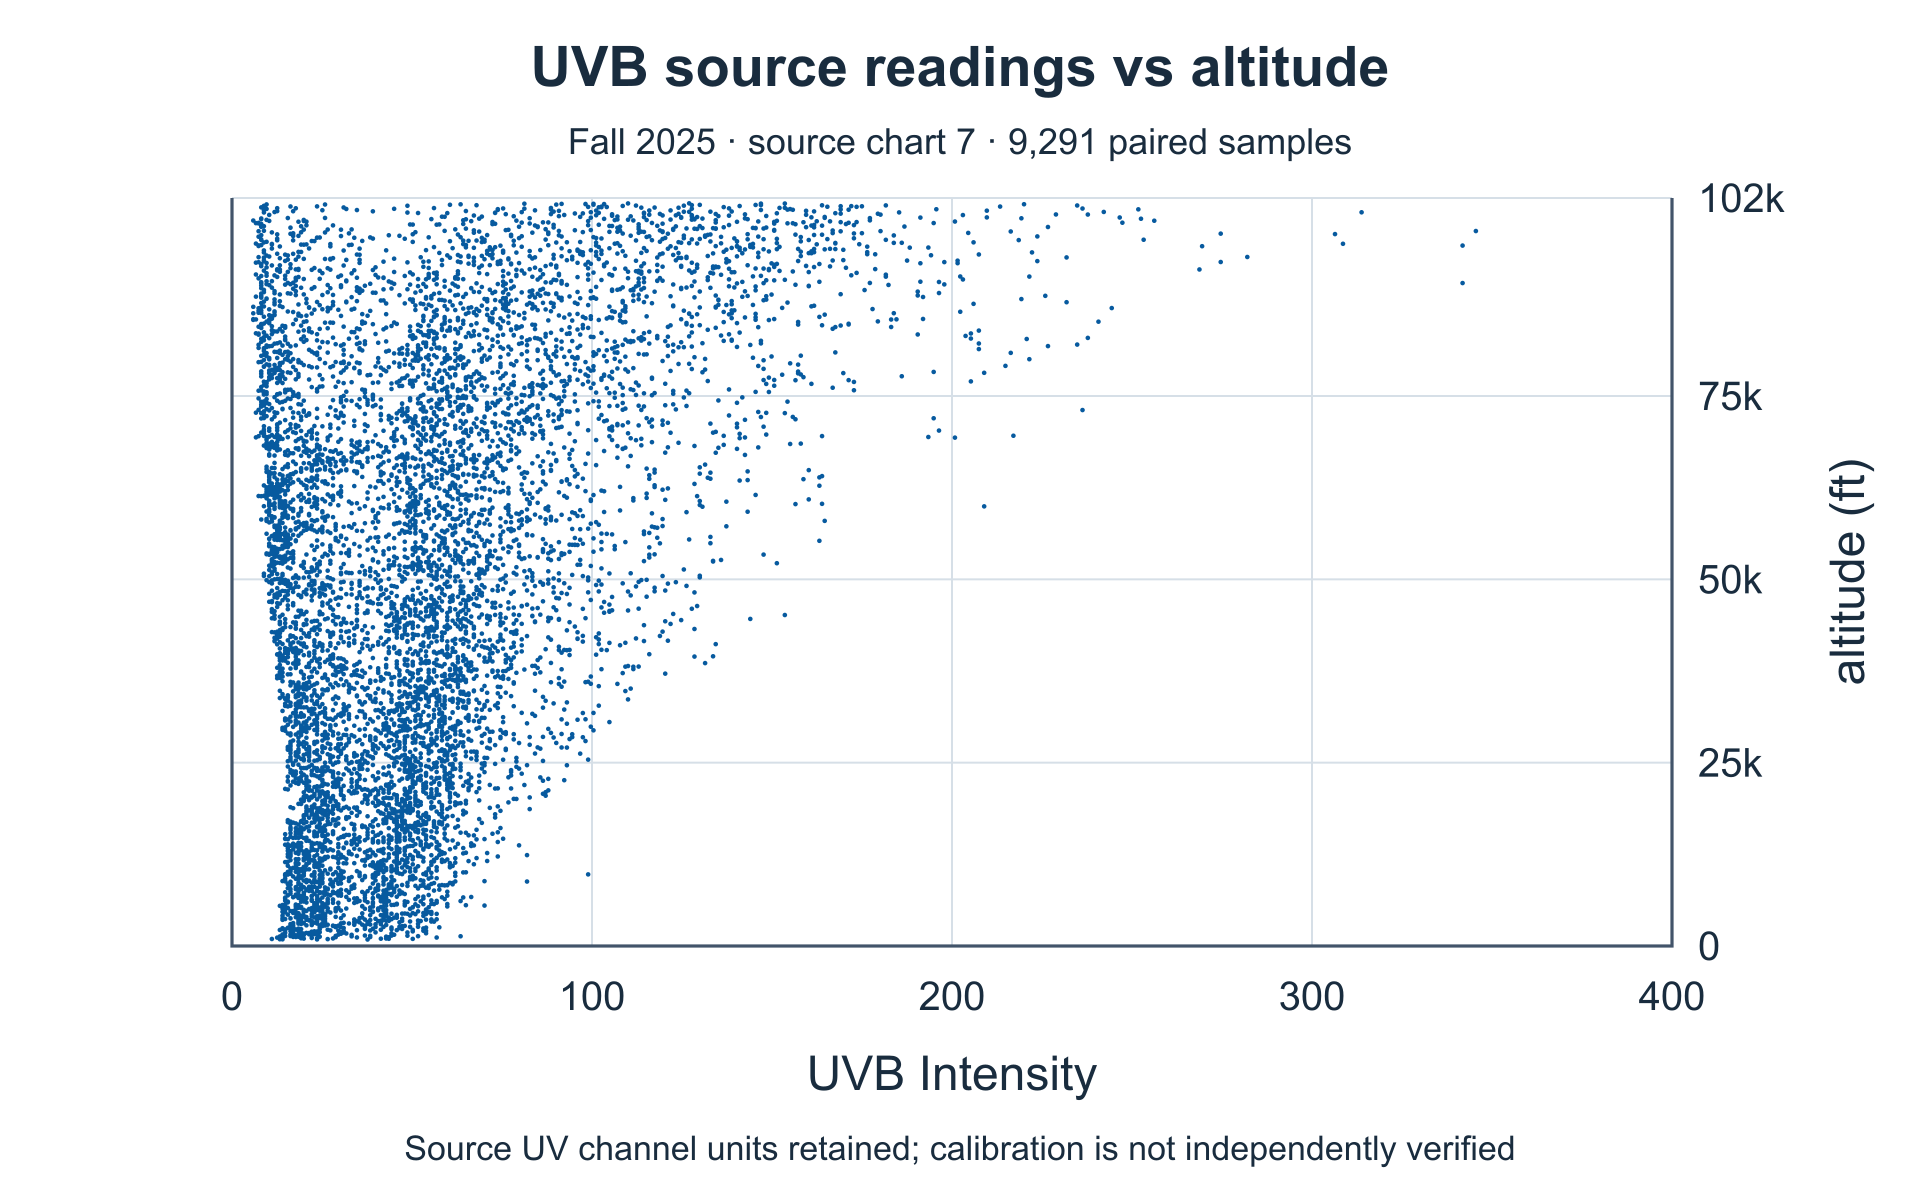
UVB channel versus altitude
The source’s independent channel scale is retained. Calibration and spectral selectivity are not established; no dose, UV-index or calibrated irradiance claim is made.
Fall 2025 acquired-data report · chart 7. Rendered from retained report values; raw series remain private. Horizontal: source UV output (units unspecified). Vertical: report altitude (ft).
Enlarge figure →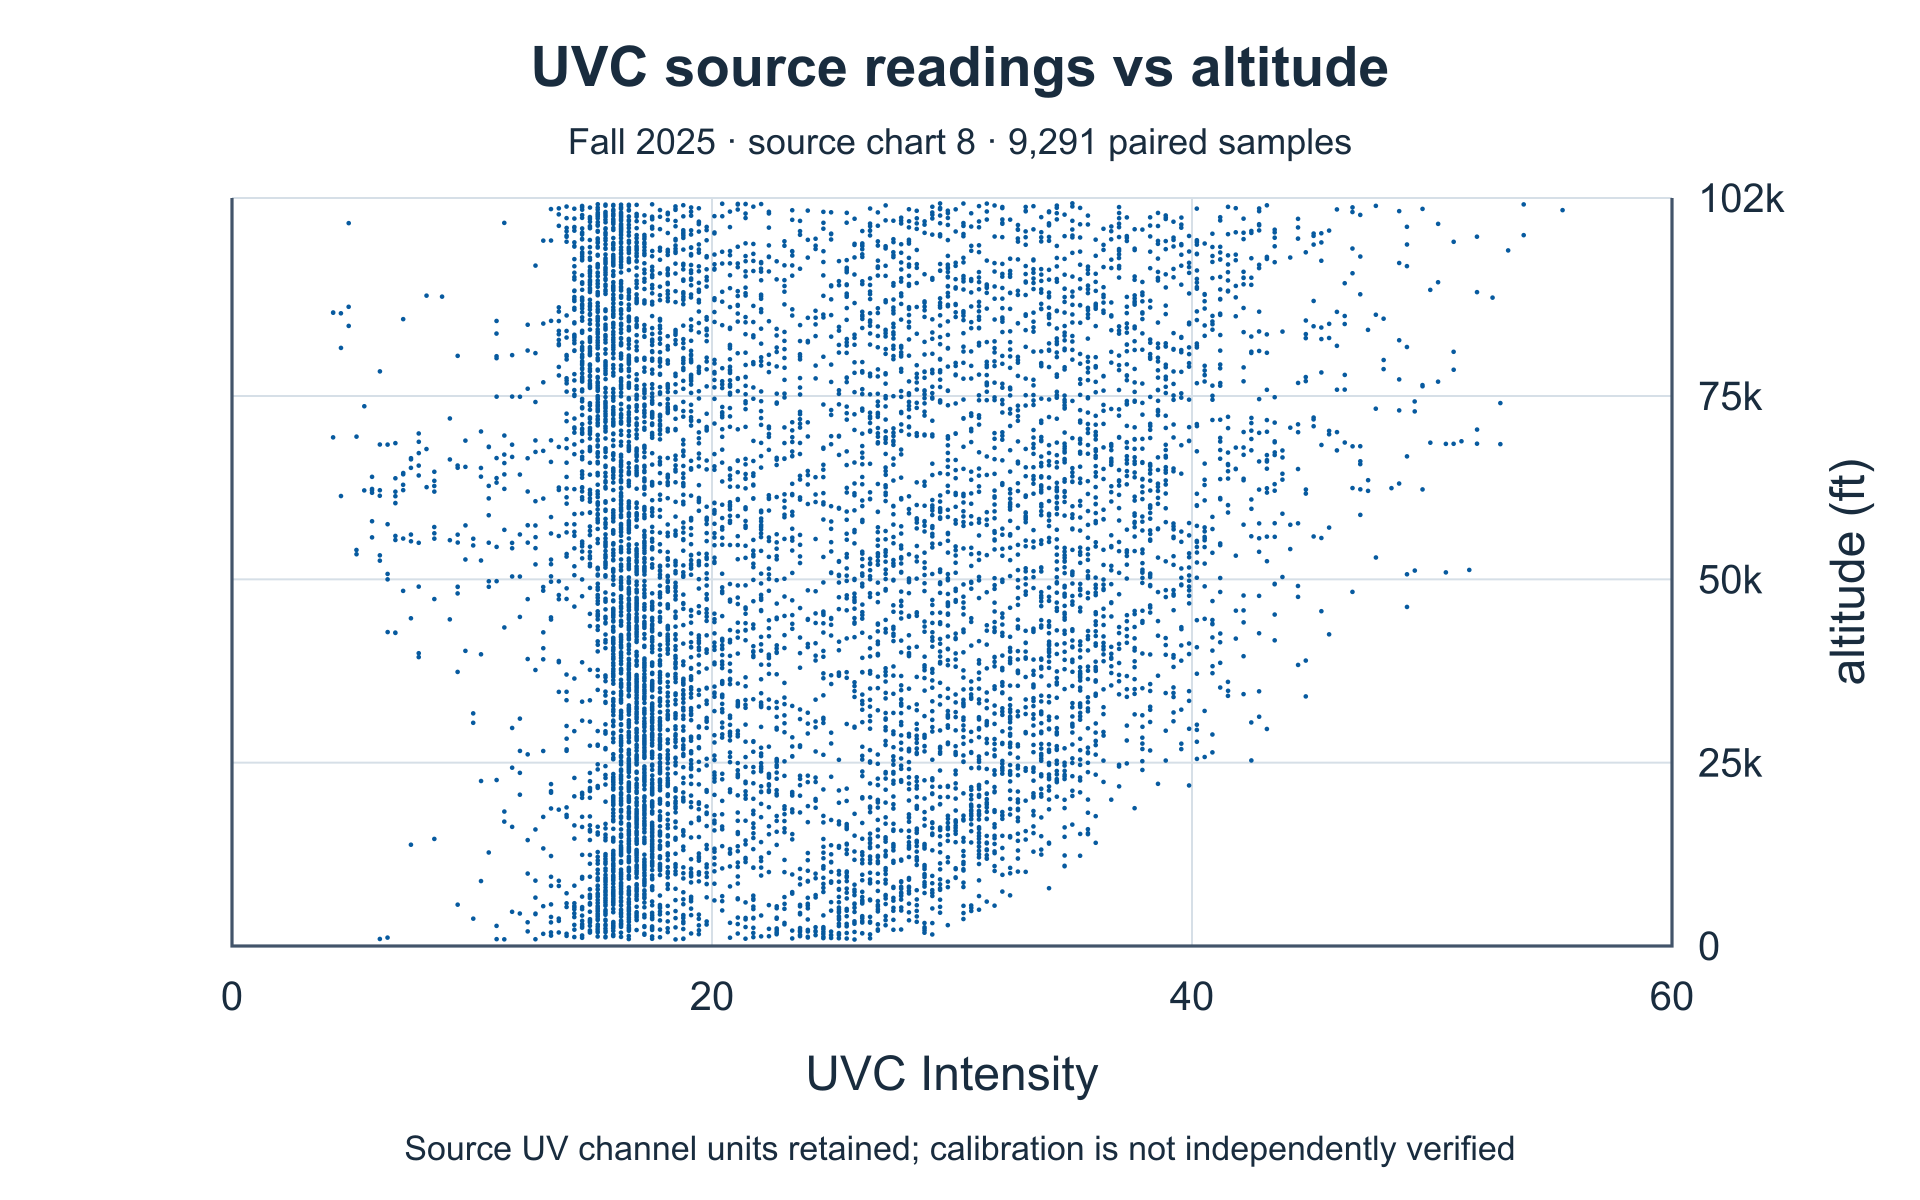
UVC channel versus altitude
The source’s independent channel scale is retained. Calibration and spectral selectivity are not established; no dose, UV-index or calibrated irradiance claim is made.
Fall 2025 acquired-data report · chart 8. Rendered from retained report values; raw series remain private. Horizontal: source UV output (units unspecified). Vertical: report altitude (ft).
Enlarge figure →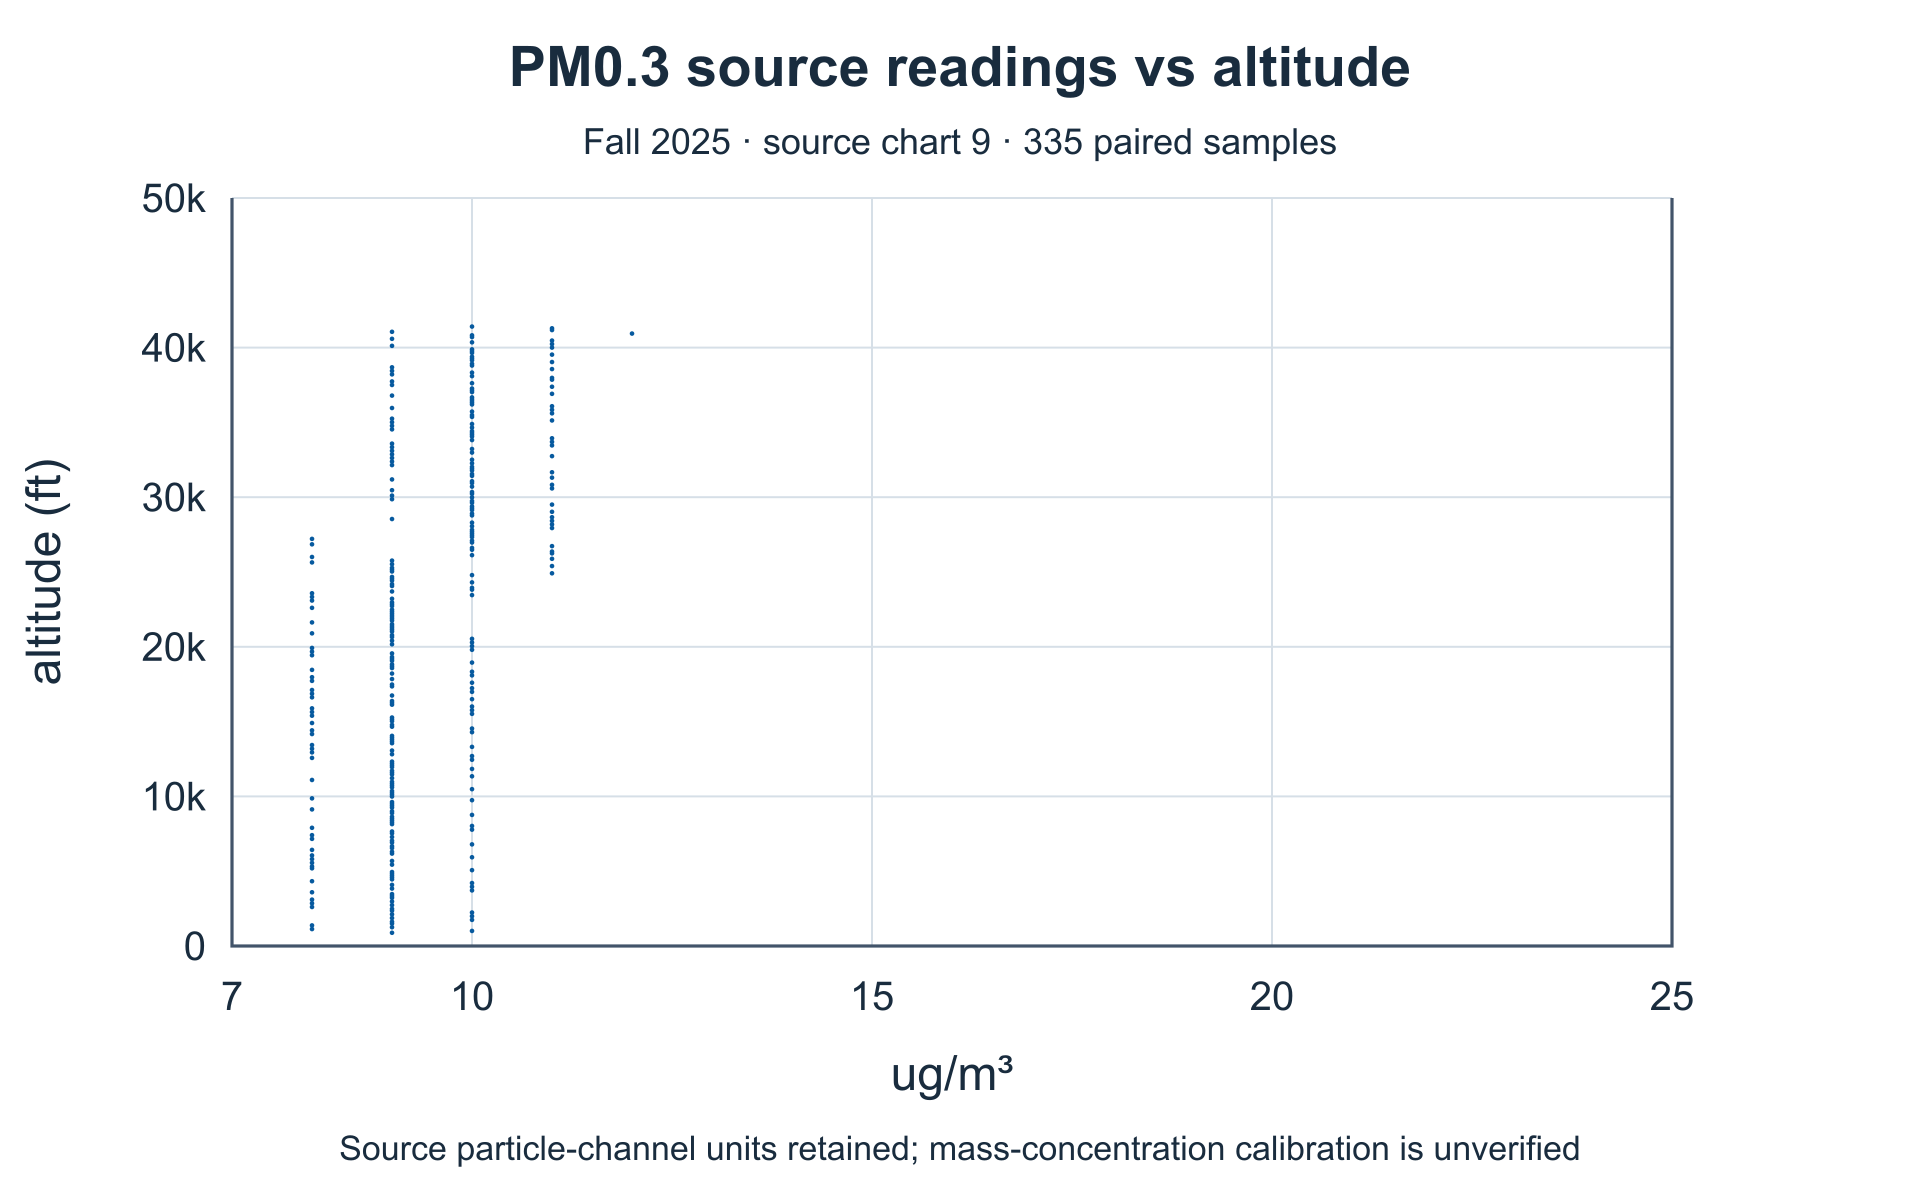
Particulate channel PM0.3: lower ascent
Source labels µg/m³ and covers about the first 28 minutes, only to roughly 41,407 ft—not the full 101,260 ft flight. Do not directly compare differently labeled Spring 2026 channels.
Fall 2025 acquired-data report · chart 9. Rendered from retained report values; raw series remain private. Horizontal: source channel (µg/m³ as labeled). Vertical: report altitude (ft).
Enlarge figure →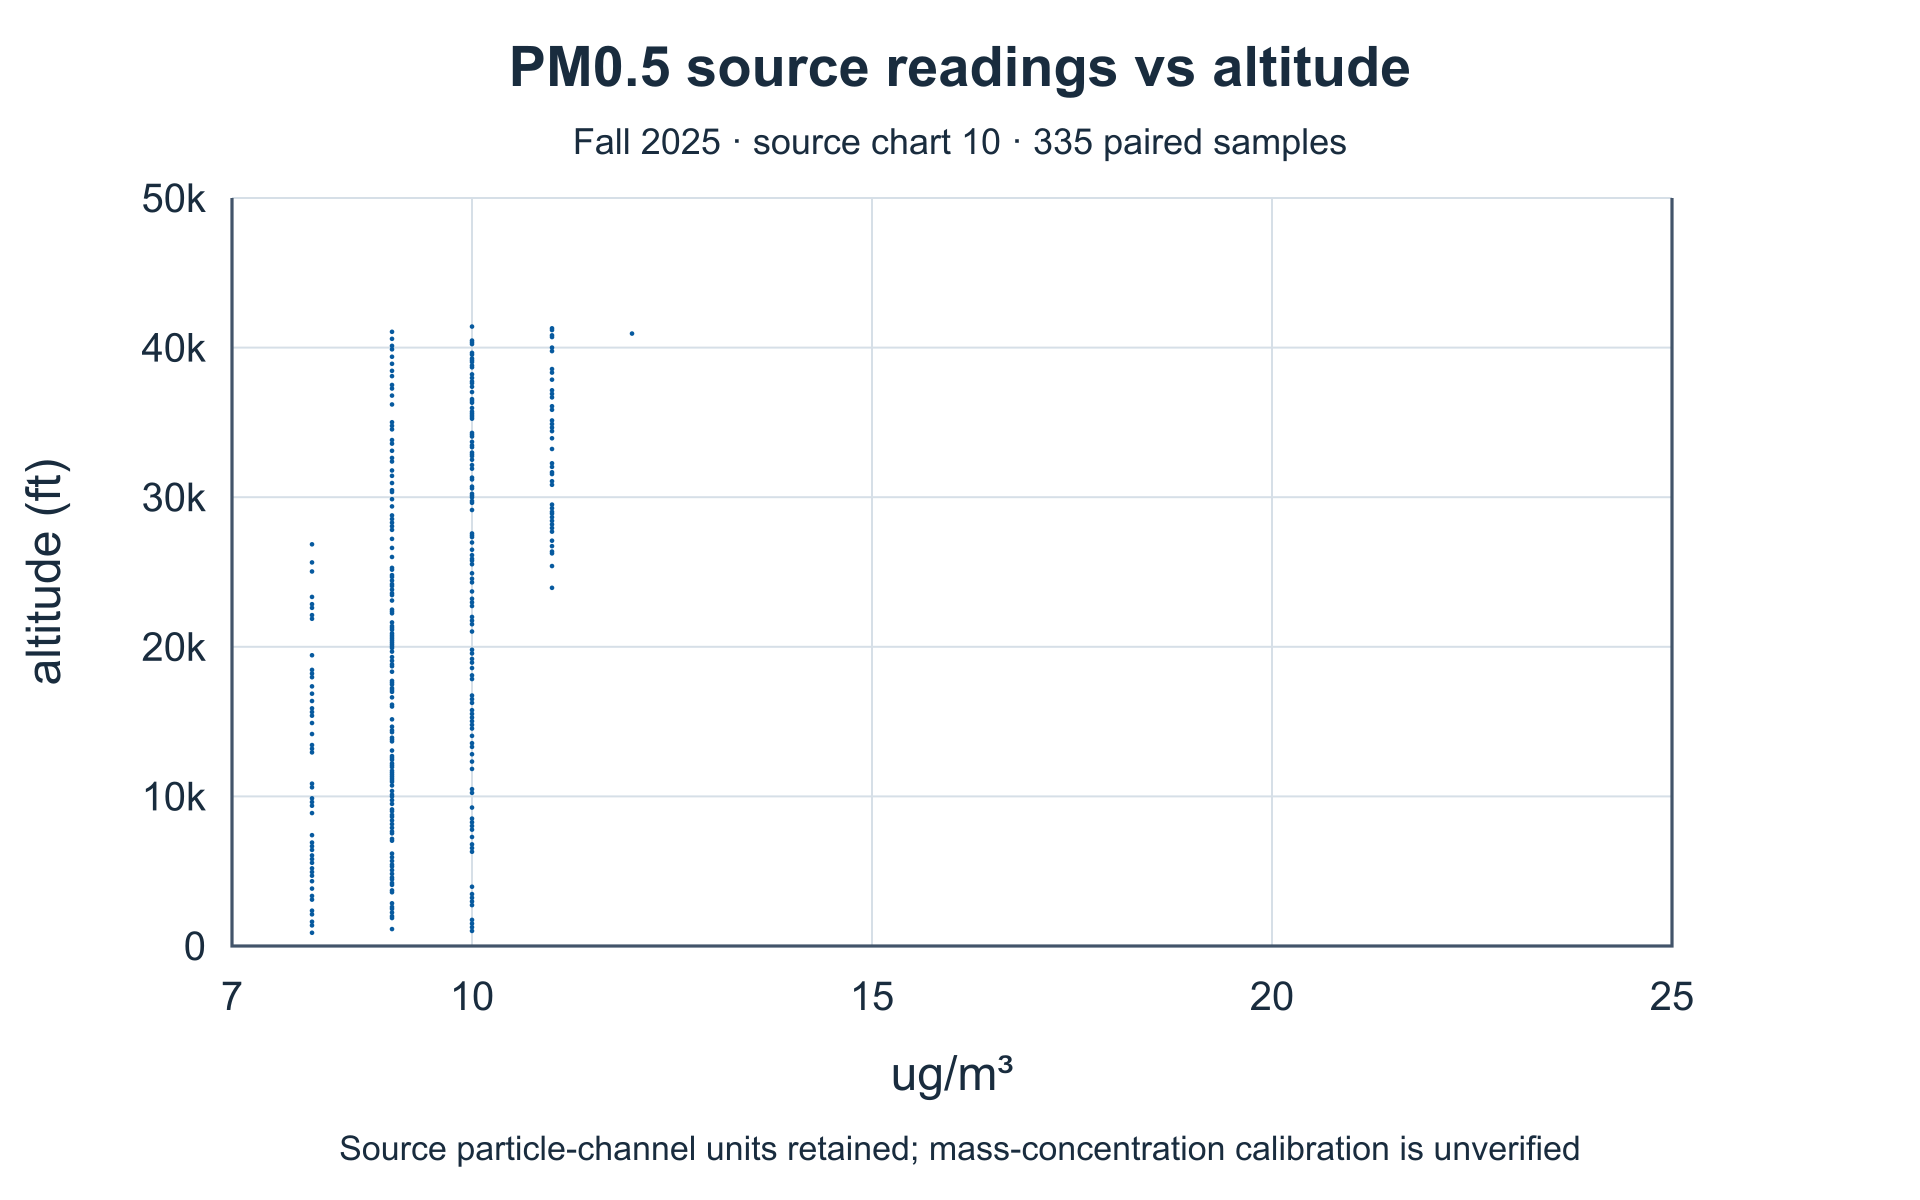
Particulate channel PM0.5: lower ascent
Source labels µg/m³ and covers about the first 28 minutes, only to roughly 41,407 ft—not the full 101,260 ft flight. Do not directly compare differently labeled Spring 2026 channels.
Fall 2025 acquired-data report · chart 10. Rendered from retained report values; raw series remain private. Horizontal: source channel (µg/m³ as labeled). Vertical: report altitude (ft).
Enlarge figure →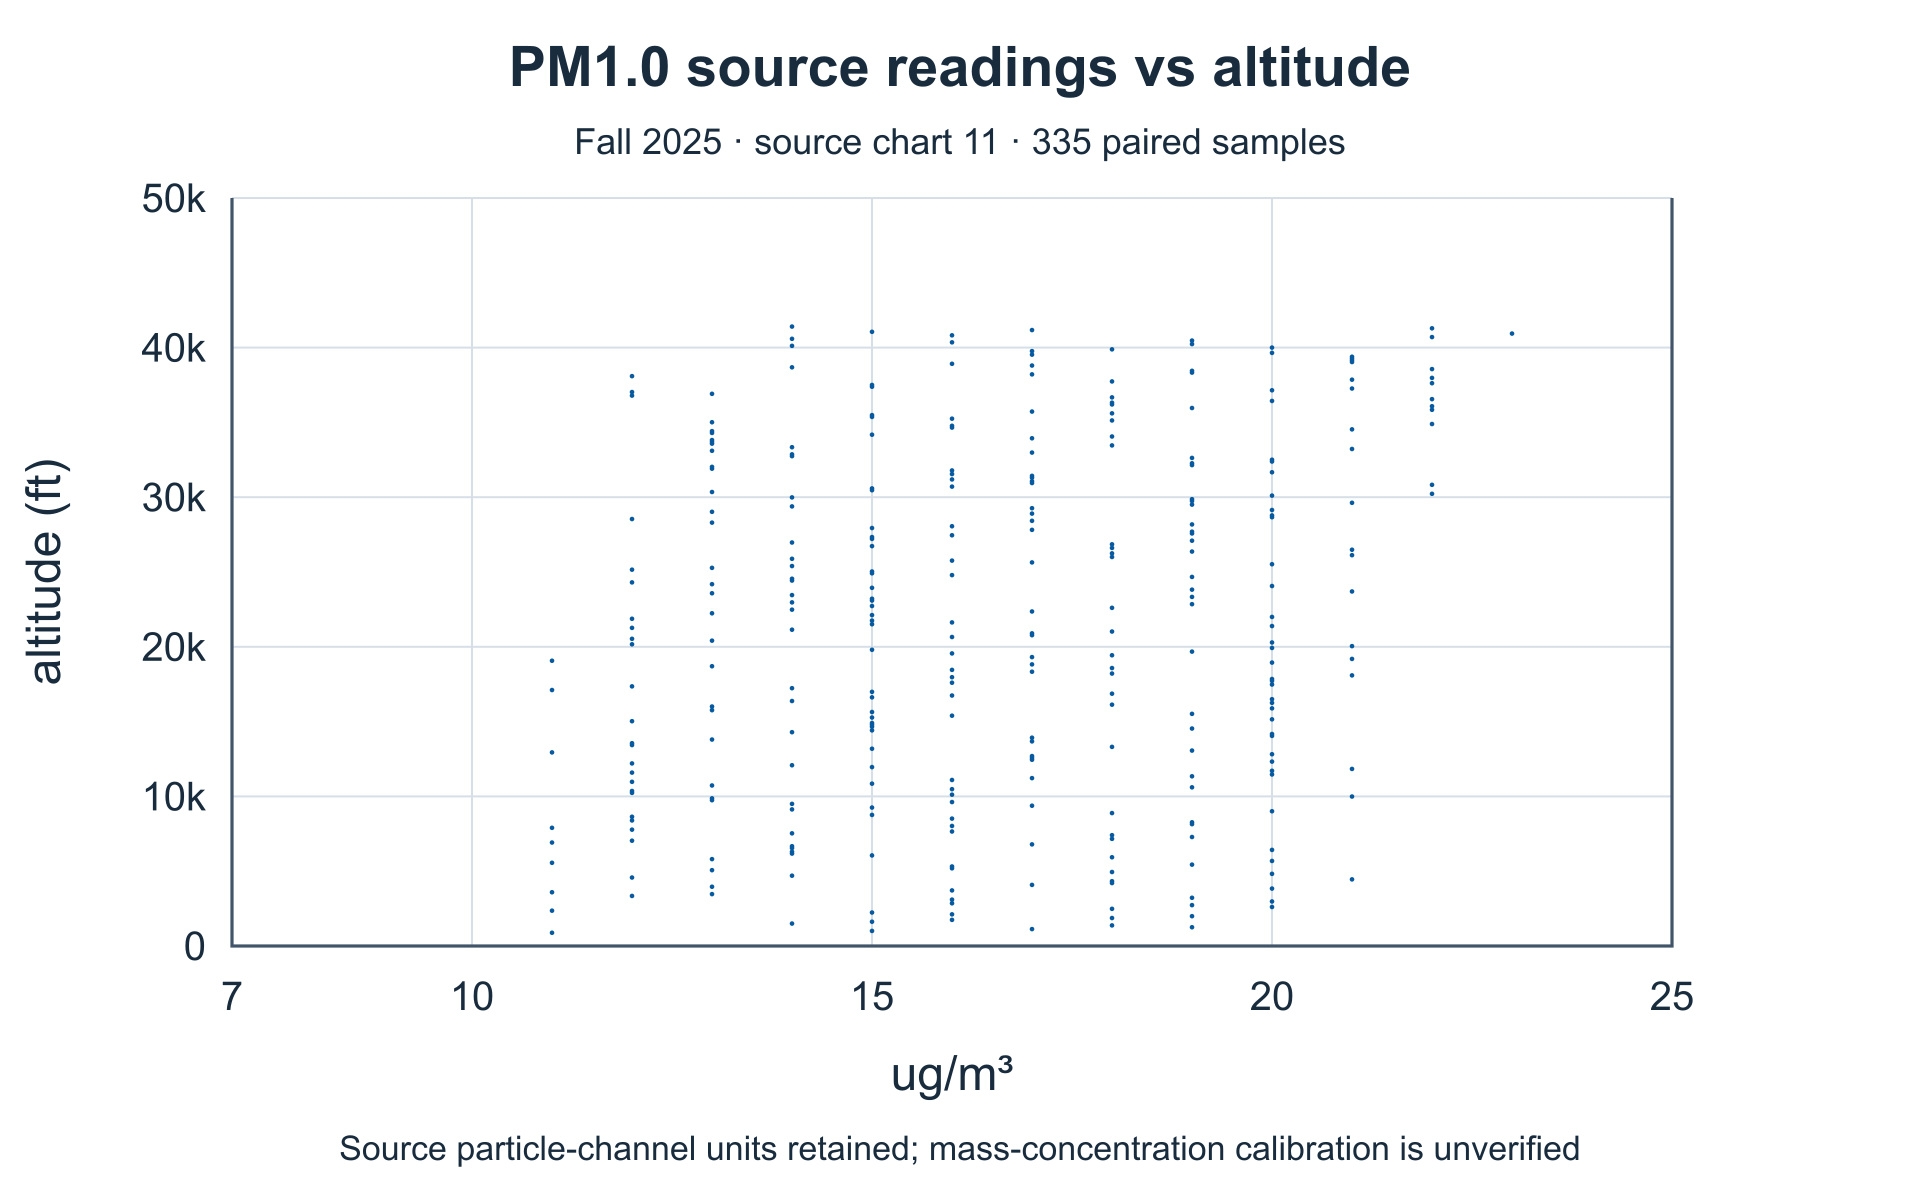
Particulate channel PM1: lower ascent
Source labels µg/m³ and covers about the first 28 minutes, only to roughly 41,407 ft—not the full 101,260 ft flight. Do not directly compare differently labeled Spring 2026 channels.
Fall 2025 acquired-data report · chart 11. Rendered from retained report values; raw series remain private. Horizontal: source channel (µg/m³ as labeled). Vertical: report altitude (ft).
Enlarge figure →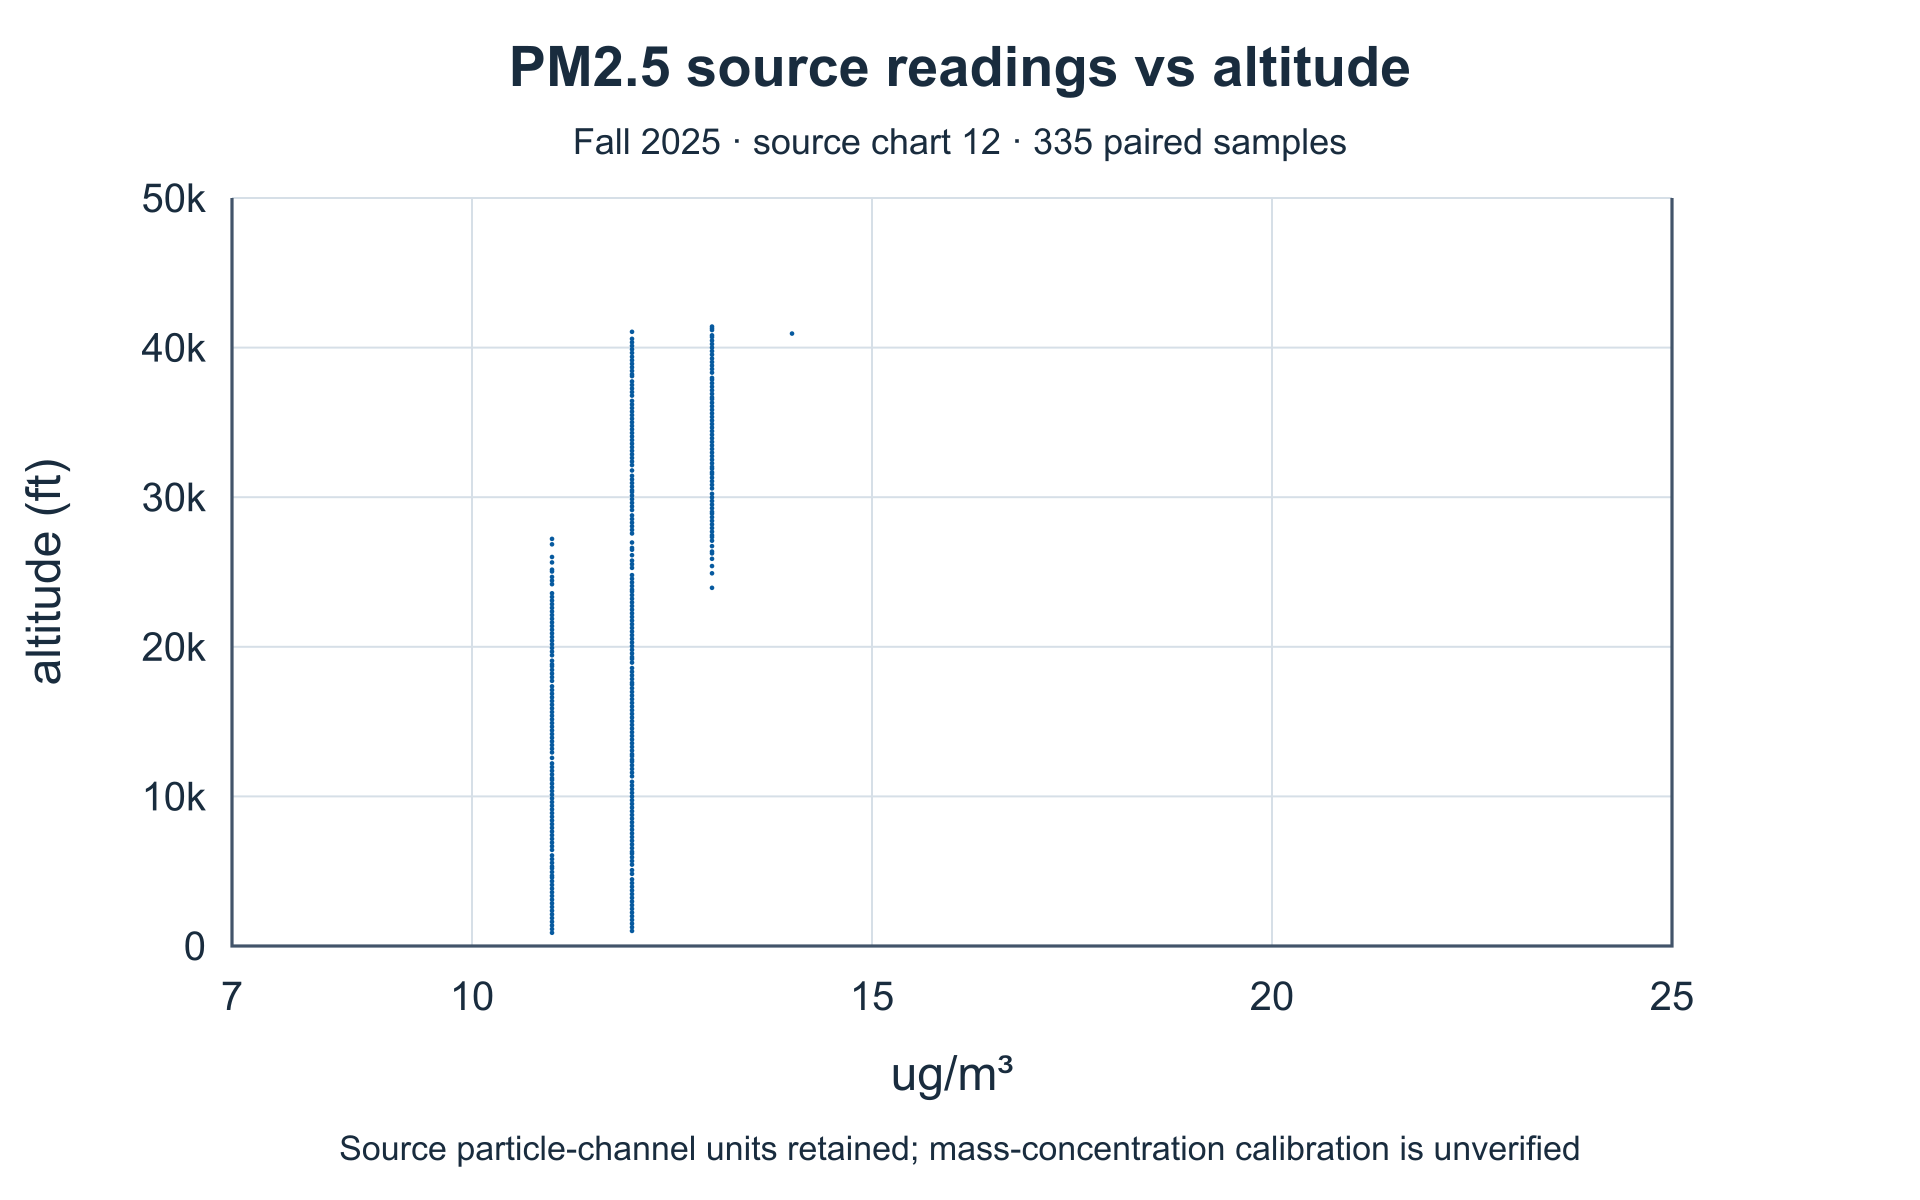
Particulate channel PM2.5: lower ascent
Source labels µg/m³ and covers about the first 28 minutes, only to roughly 41,407 ft—not the full 101,260 ft flight. Do not directly compare differently labeled Spring 2026 channels.
Fall 2025 acquired-data report · chart 12. Rendered from retained report values; raw series remain private. Horizontal: source channel (µg/m³ as labeled). Vertical: report altitude (ft).
Enlarge figure →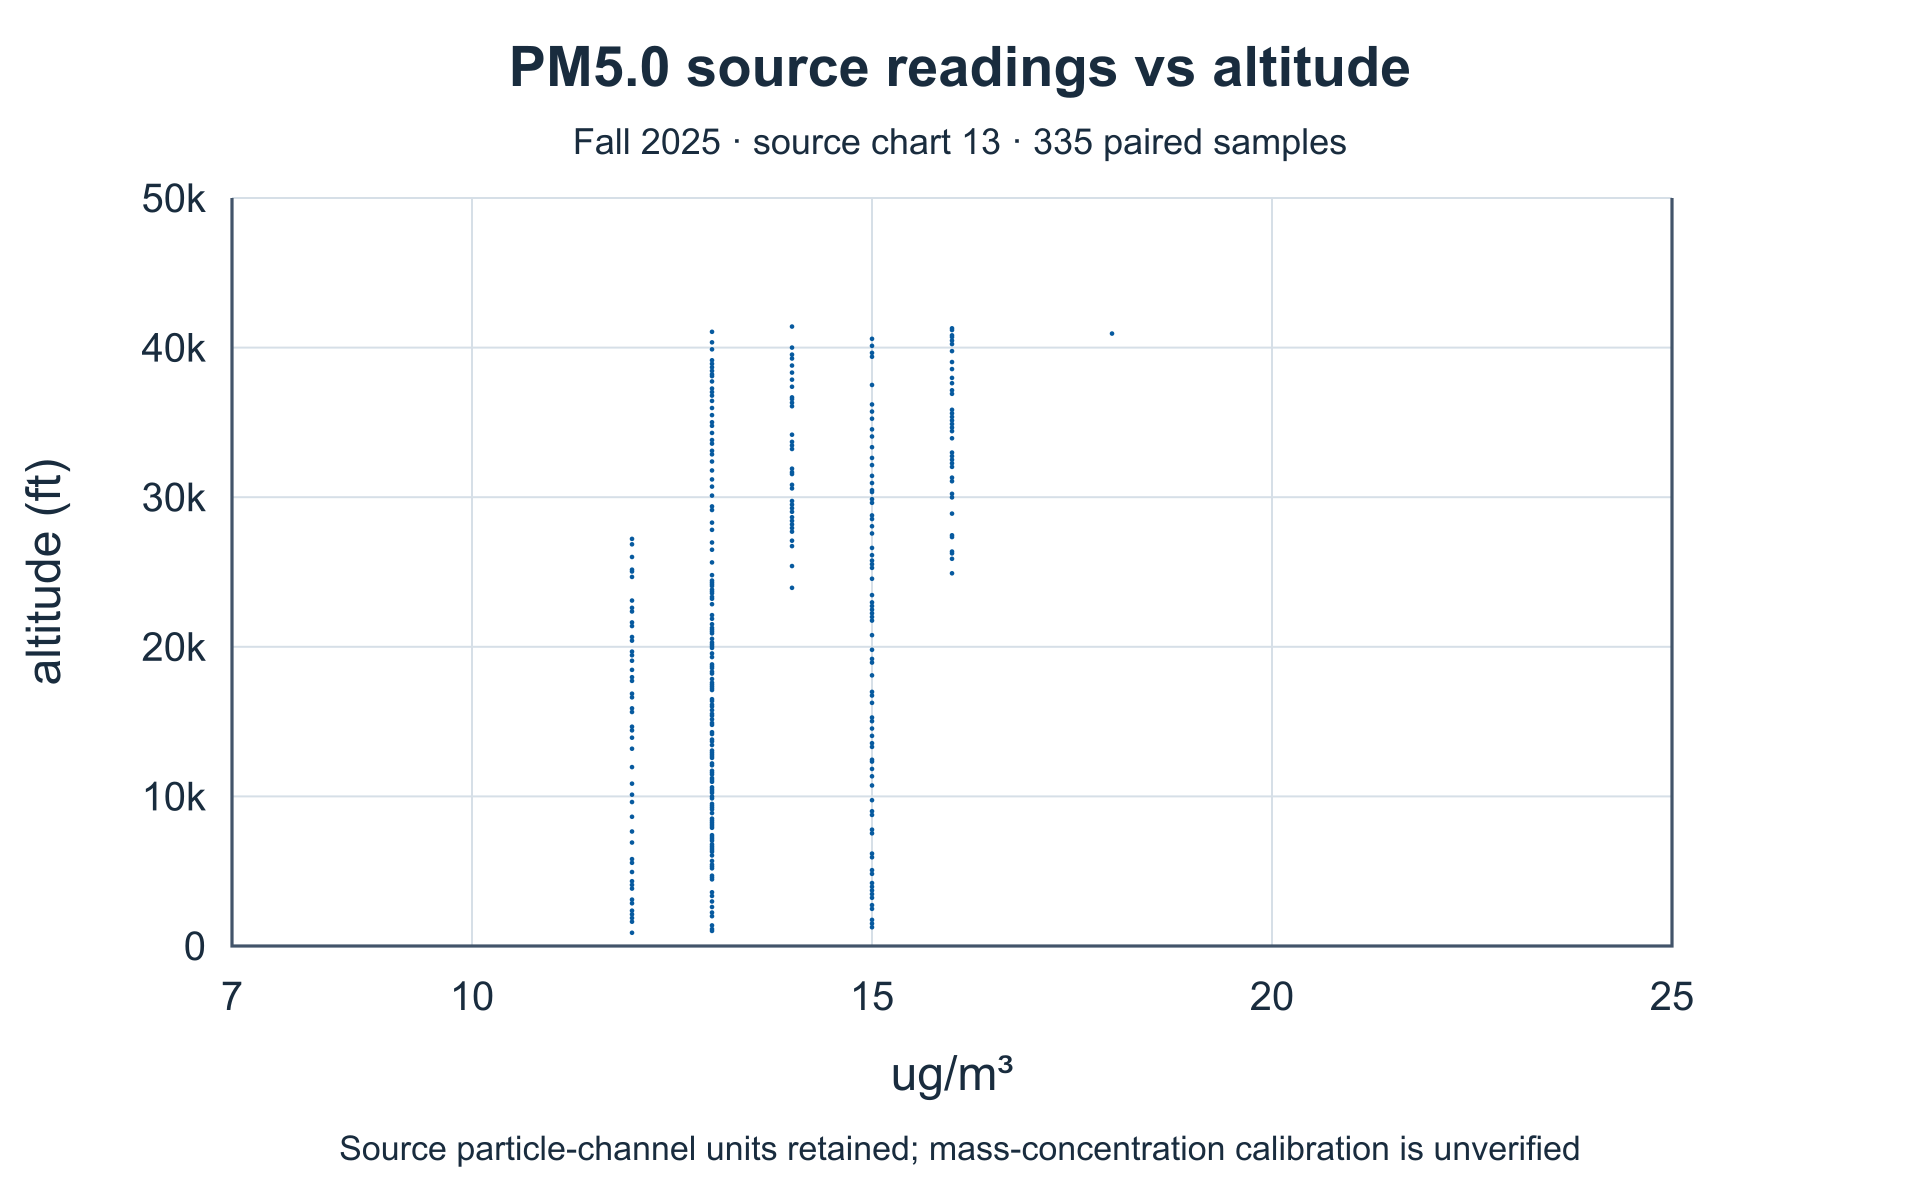
Particulate channel PM5: lower ascent
Source labels µg/m³ and covers about the first 28 minutes, only to roughly 41,407 ft—not the full 101,260 ft flight. Do not directly compare differently labeled Spring 2026 channels.
Fall 2025 acquired-data report · chart 13. Rendered from retained report values; raw series remain private. Horizontal: source channel (µg/m³ as labeled). Vertical: report altitude (ft).
Enlarge figure →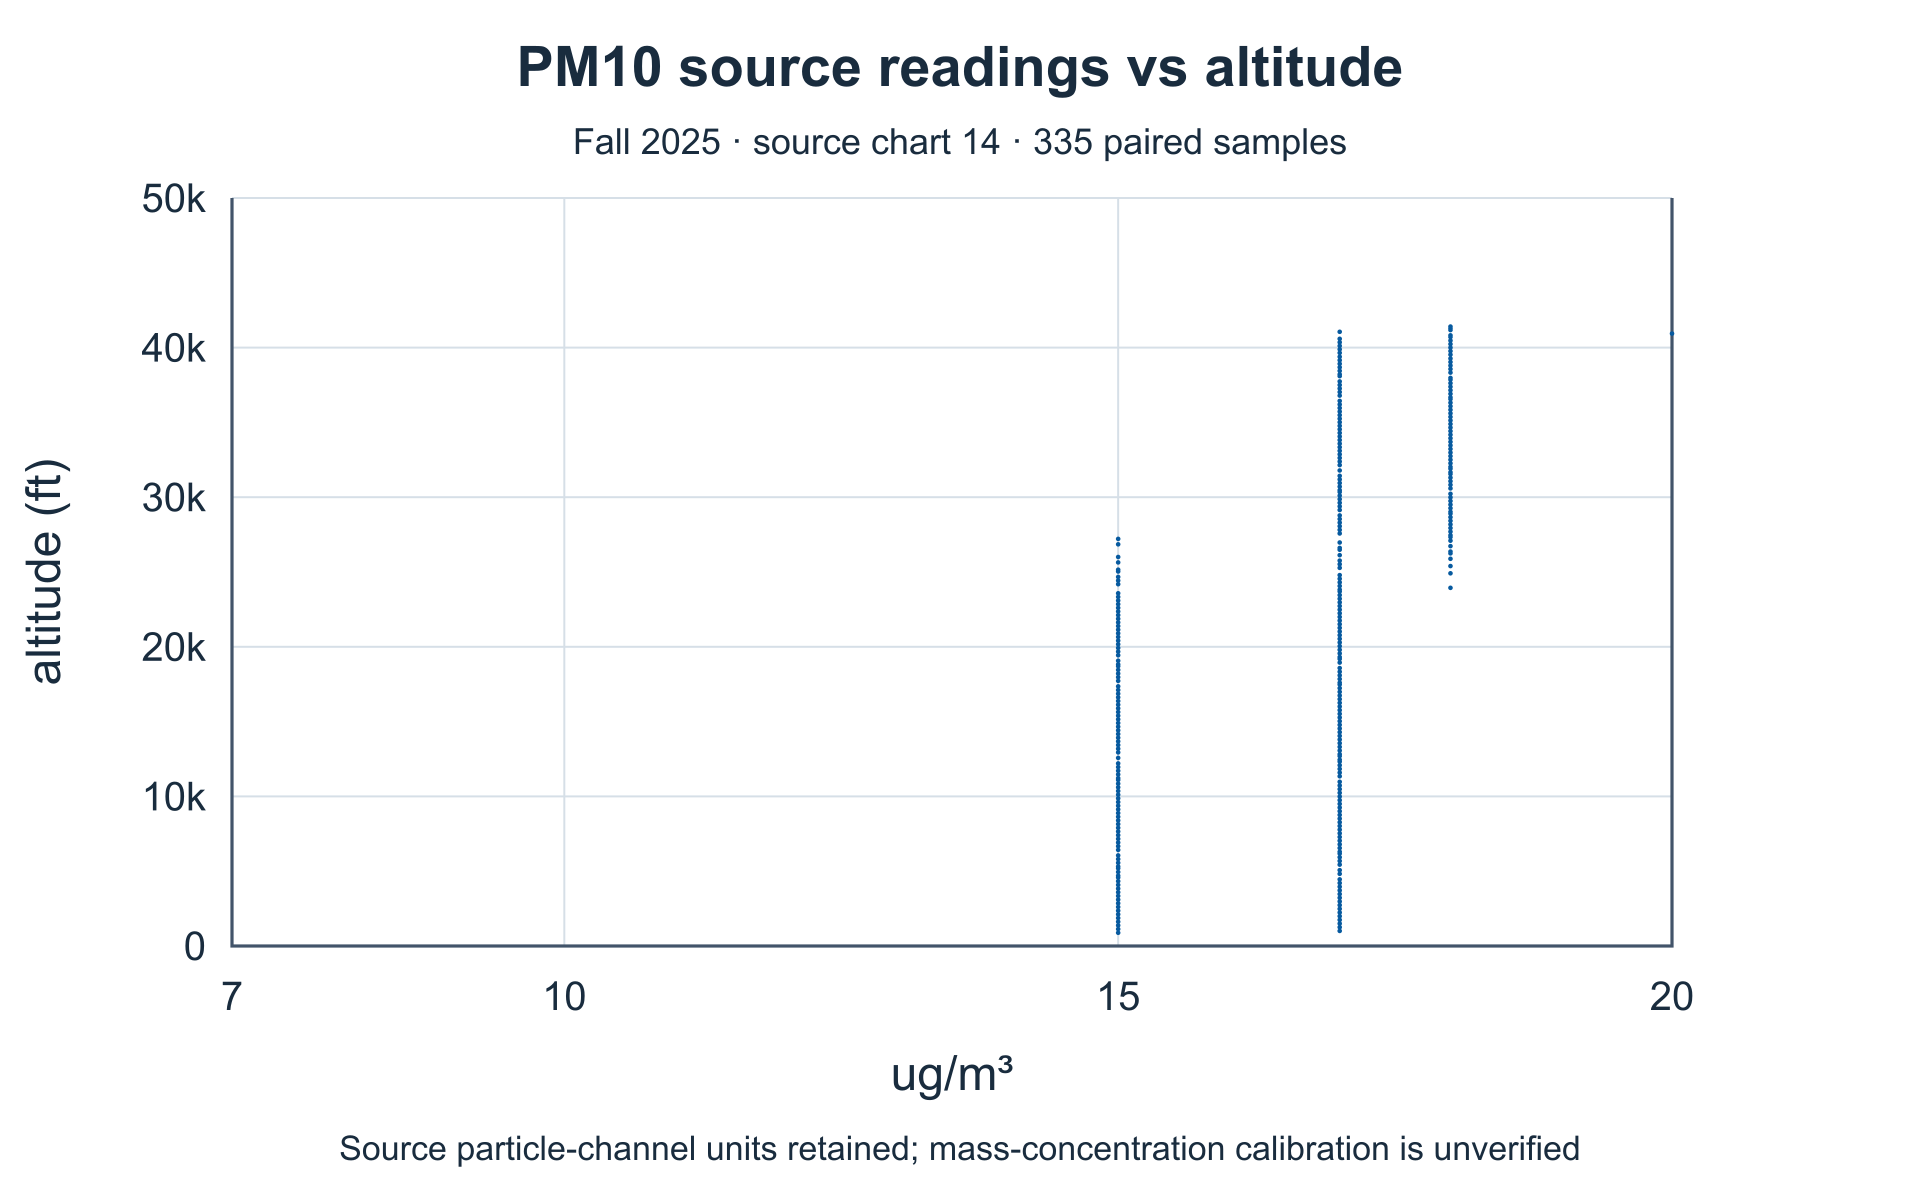
Particulate channel PM10: lower ascent
Source labels µg/m³ and covers about the first 28 minutes, only to roughly 41,407 ft—not the full 101,260 ft flight. Do not directly compare differently labeled Spring 2026 channels.
Fall 2025 acquired-data report · chart 14. Rendered from retained report values; raw series remain private. Horizontal: source channel (µg/m³ as labeled). Vertical: report altitude (ft).
Enlarge figure →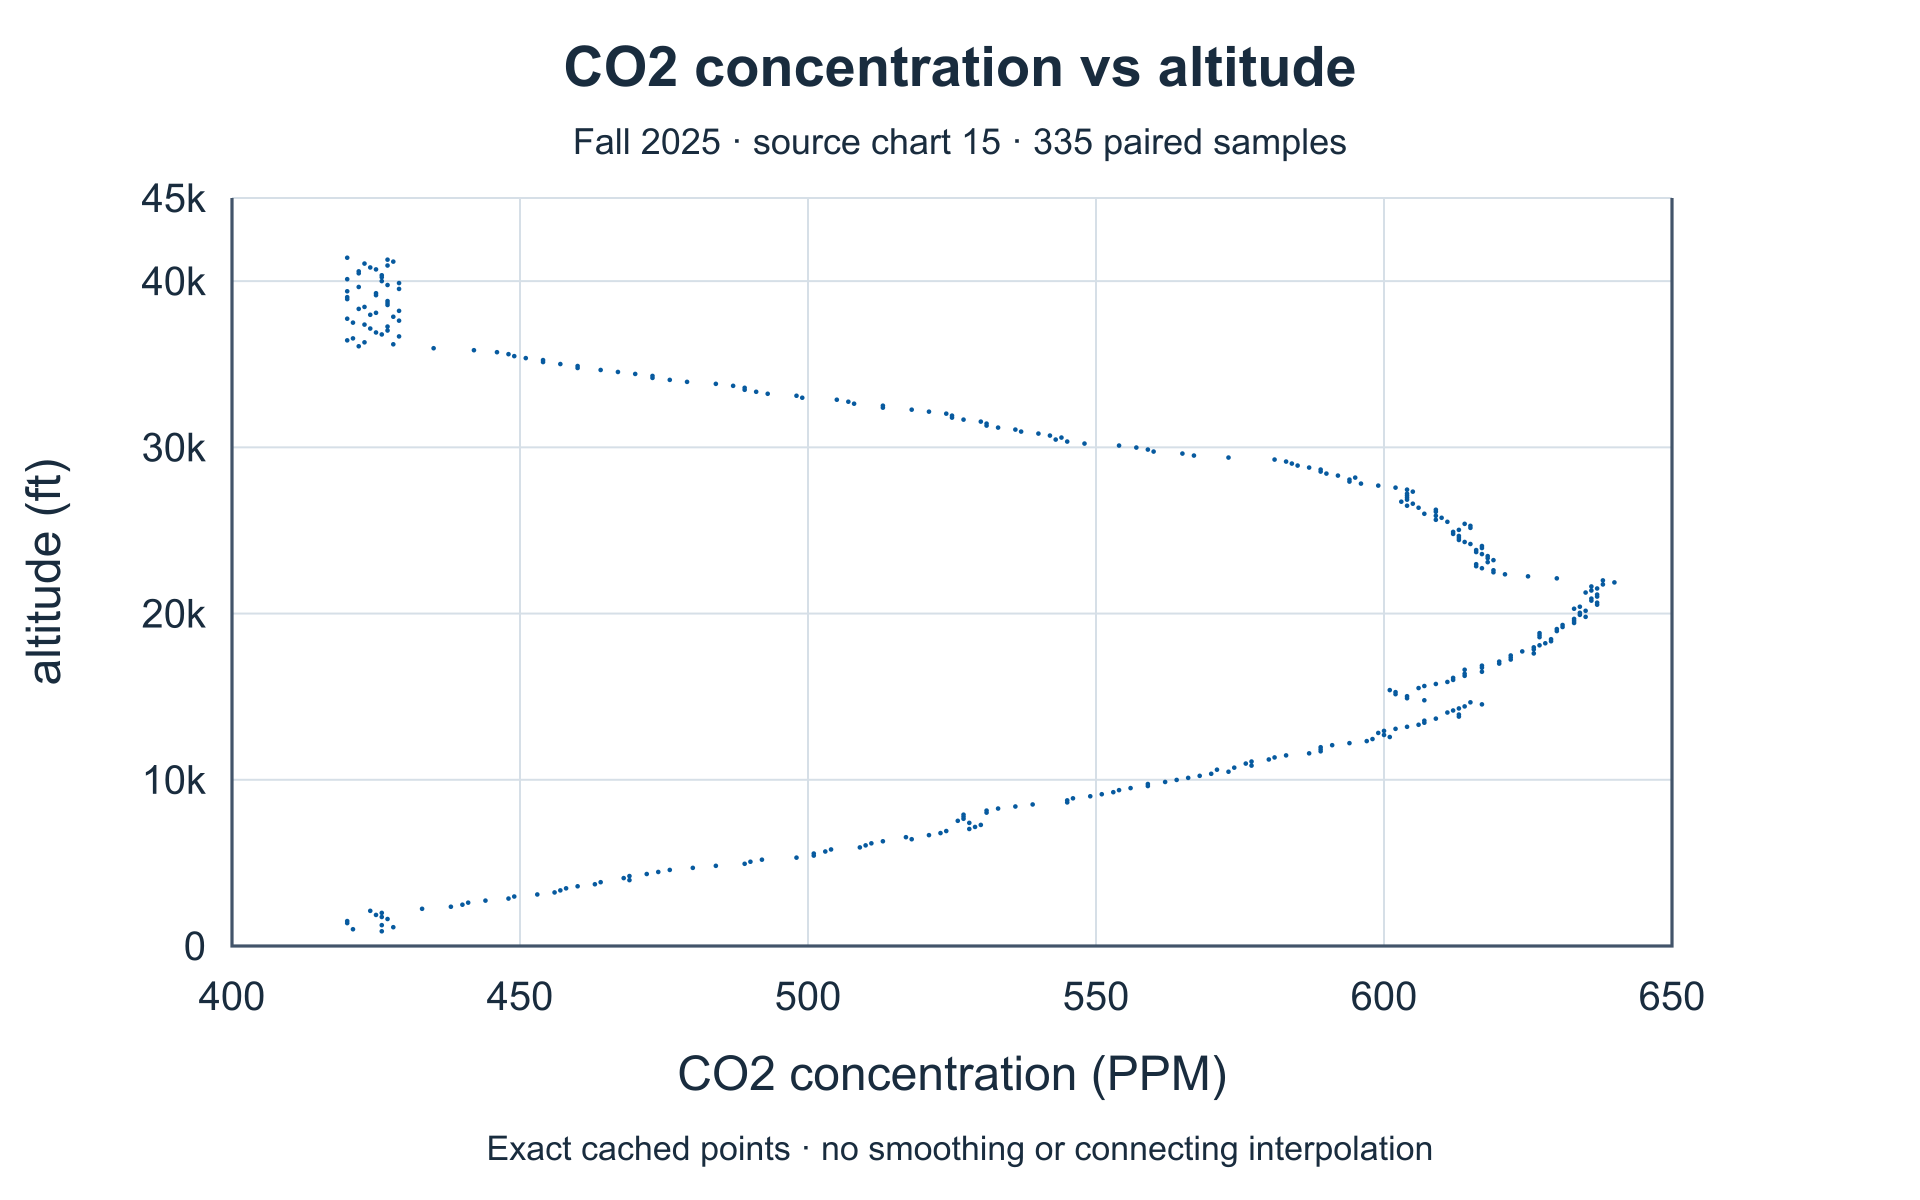
CO₂ channel: lower ascent
Values peak at 640 ppm near 21,874 ft, whereas prose says 21,118 ft. Coverage is roughly 885–41,407 ft. The source’s airline-exhaust explanation remains a hypothesis.
Fall 2025 acquired-data report · chart 15. Rendered from retained report values; raw series remain private. Horizontal: ppm. Vertical: report altitude (ft).
Enlarge figure →Source notes that matter.
- Acceleration time resets. Points are not joined into a fabricated continuous timeline.
- Particulate and CO₂ records cover lower ascent, to approximately 41,407 ft.
- The November 2024 radiation figure on a later poster is not assigned to this flight. No replacement radiation curve is invented.
Source: team-supplied “Fall 2025 launch acquired data” report and photographed presentation boards. Student research, not independent instrument certification. Detector counts are not dose; channel output is not automatically calibrated concentration or irradiance.
Scientific context: NASA atmospheric radiation research · NOAA ultraviolet radiation background. Context does not validate these instruments.