Release and ascent
18-second excerpt · The camera leaves the launch area and rises above the landscape.

Two semesters, two flight records. Explore the team's original radiation and atmosphere figures alongside its Spring and Fall photographs, roles and payload improvements.
Read the December 6 flight’s reported performance, examine the payload hardware and meet the Spring and Fall teams.
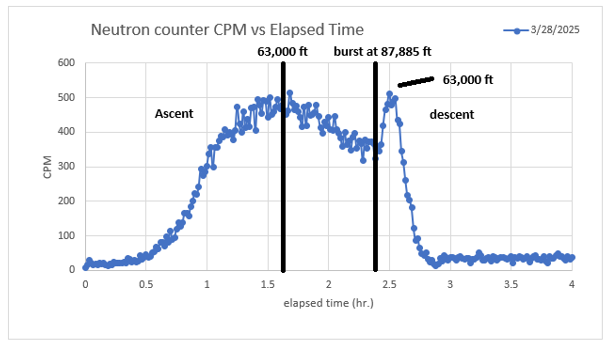
The source marks the Pfotzer–Regener radiation maximum near 63,000 ft, below the flight's reported 87,885-ft maximum. Counts per minute and altitude describe different quantities.
The graph legend prints March 28, while the team's flight poster prints March 29. Both labels remain attributed to their sources; this does not establish attendance on either date.
Explore the Spring 2025 research figures →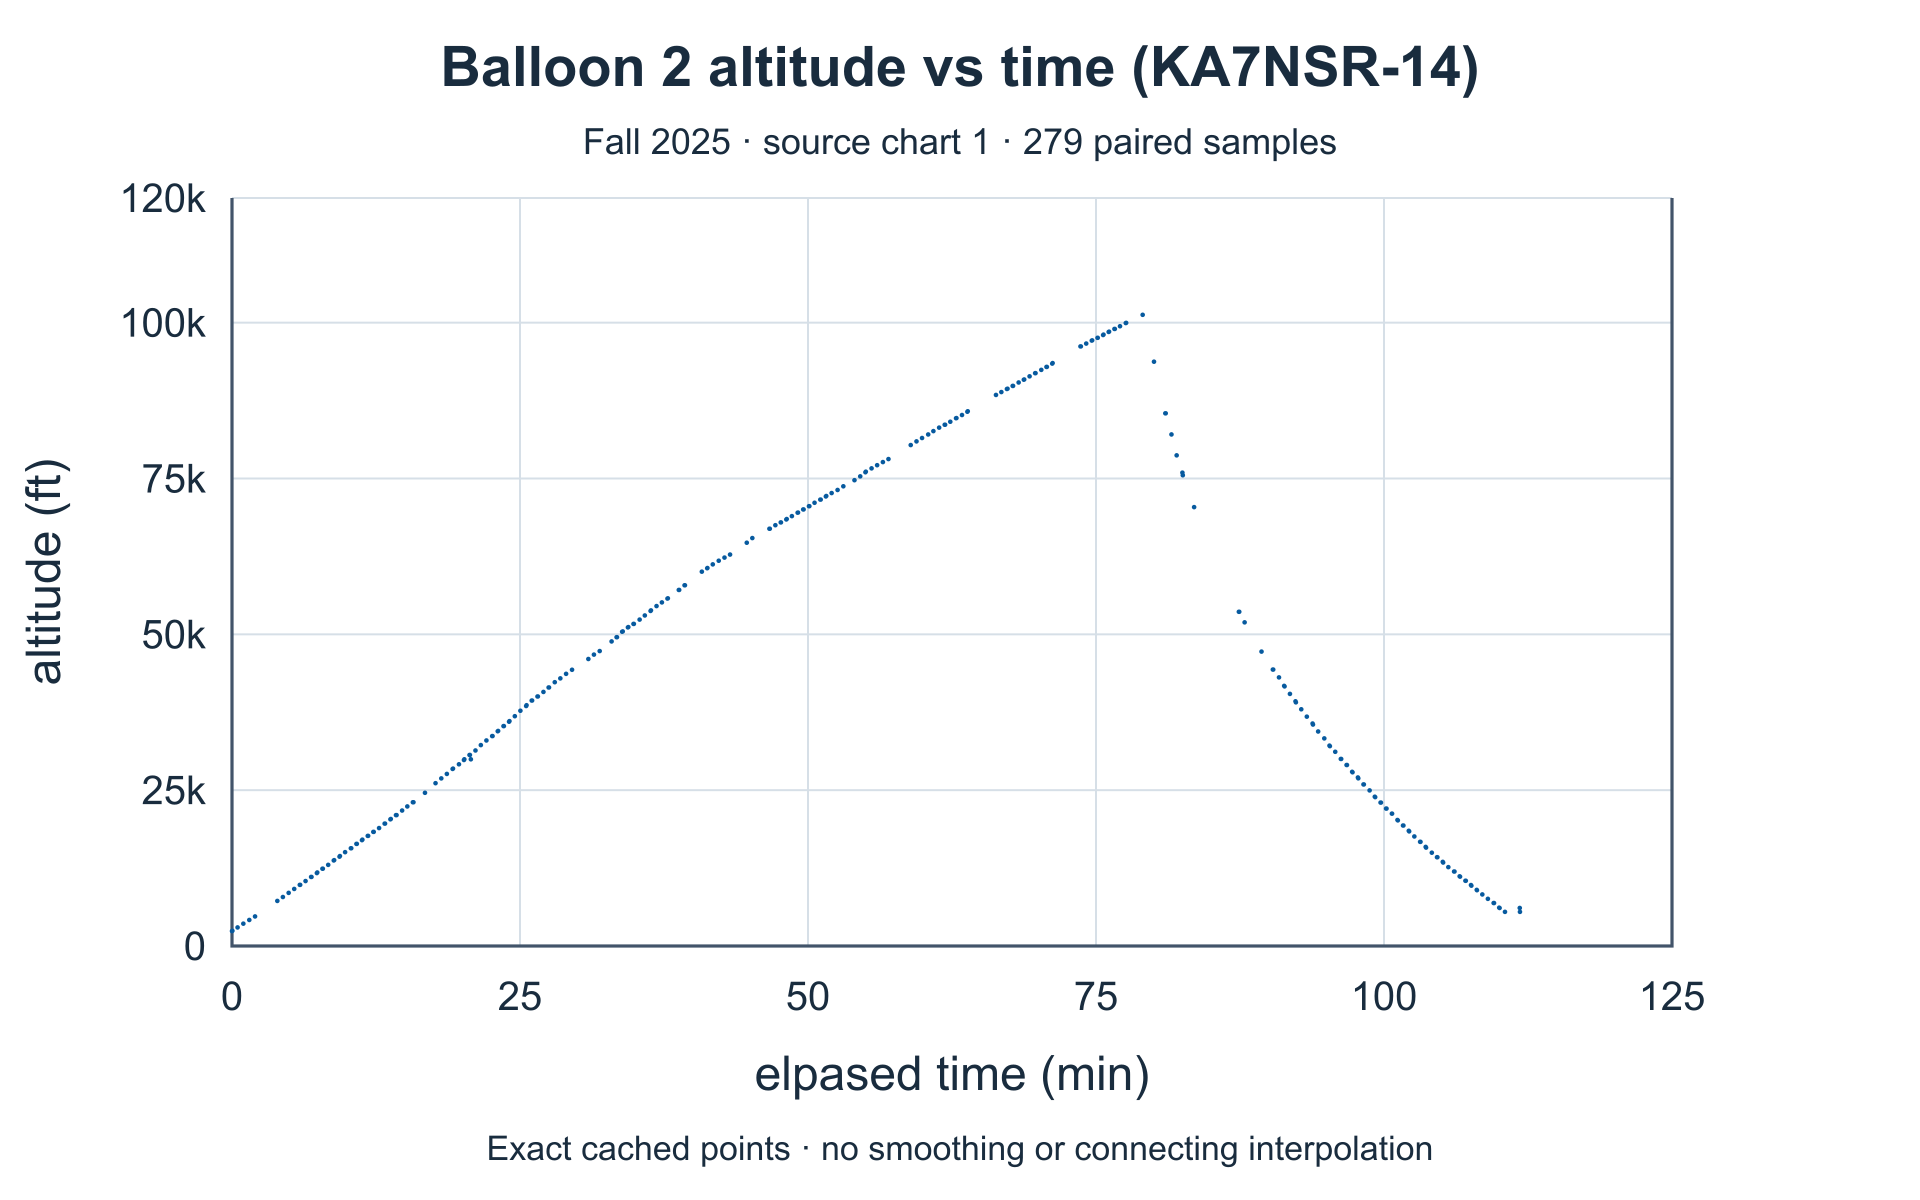
The supplied report follows altitude, vertical motion, acceleration, temperature, pressure, particles, CO₂ and UV observations. This figure retains the source's numeric time–altitude pairing without adding a smoothed illustrative curve.
The report narrative gives 77.6 minutes to burst and 96.2 mph maximum descent; its plotted series gives 79.05 minutes and −92.57 mph vertical velocity. These are separate source values, not a reconciled estimate. The negative sign denotes downward motion.
Explore the Fall 2025 research figures →| Reported average ascent | 13.8 mph |
|---|---|
| Reported peak descent | 96.2 mphWritten report; plotted minimum: −92.57 mph |
| Reported terminal descent | 16 mph |
| Reported peak acceleration | 6.45 G near burst |
| Reported lowest pressure | 49.2 Torr |
| Reported CO₂ peakLower-ascent window | 640 ppm at 21,118 ftWritten report; plotted peak: 640 ppm near 21,874 ft |
| Reported ground CO₂ average | Approximately 425 ppm |
| Particle feature | Reported particle-channel response change near 26,800 ft |
The published CO₂ and particle profiles cover approximately 885–41,407 ft of lower ascent, not the full 101,260-ft flight. A peak here means the highest value within that published measurement window. The report proposes further investigation of the particle feature; its cause is not established.
Mentors: Dr. Eddie Ong;
Ernest Villicaña
Team lead:
Rafael Sanchez
Atmospheric profiling:
Dr. Eddie Ong, Marquis Muza, Nathaniel Okafor, Adam Fuge
Video stabilization:
Marquis Muza, Nathaniel Okafor
Mechanical:
Rafael Sanchez, Elvis Garcia
Software & electrical:
Adam Fuge, Nathaniel Okafor, Marquis Muza, Ethan Pierson
Advisors:
Andrew Sherant, Tino Meza, Tracy Concialdi, Garret Nordmeyer
Mentors: Dr. Eddie Ong;
Ernest Villicaña
Team lead:
Nathaniel “Nate” Okafor
Atmospheric profiling & video:
Preston Furulie, Nathaniel Okafor, Adam Fuge
Software & coding:
Emma Landis, Ethan Pierson
Mechanical:
Garret Nordmeyer, Loukos Stevenson
Electrical:
Adam Fuge, Jose Ocampo
Advisor:
Tino Meza
See the composite structure, camera mount, integrated sensor stack, UV array, and radiation instrument.
Open the image archiveThe Spring launch-site group and Fall classroom group keep their own semester labels and source captions. Names in the photographs are distinct from the presentation roles documented above.
Faculty mentors: Dr. Eddie Ong · science and Ernest Villicaña (Mr V) · engineering.
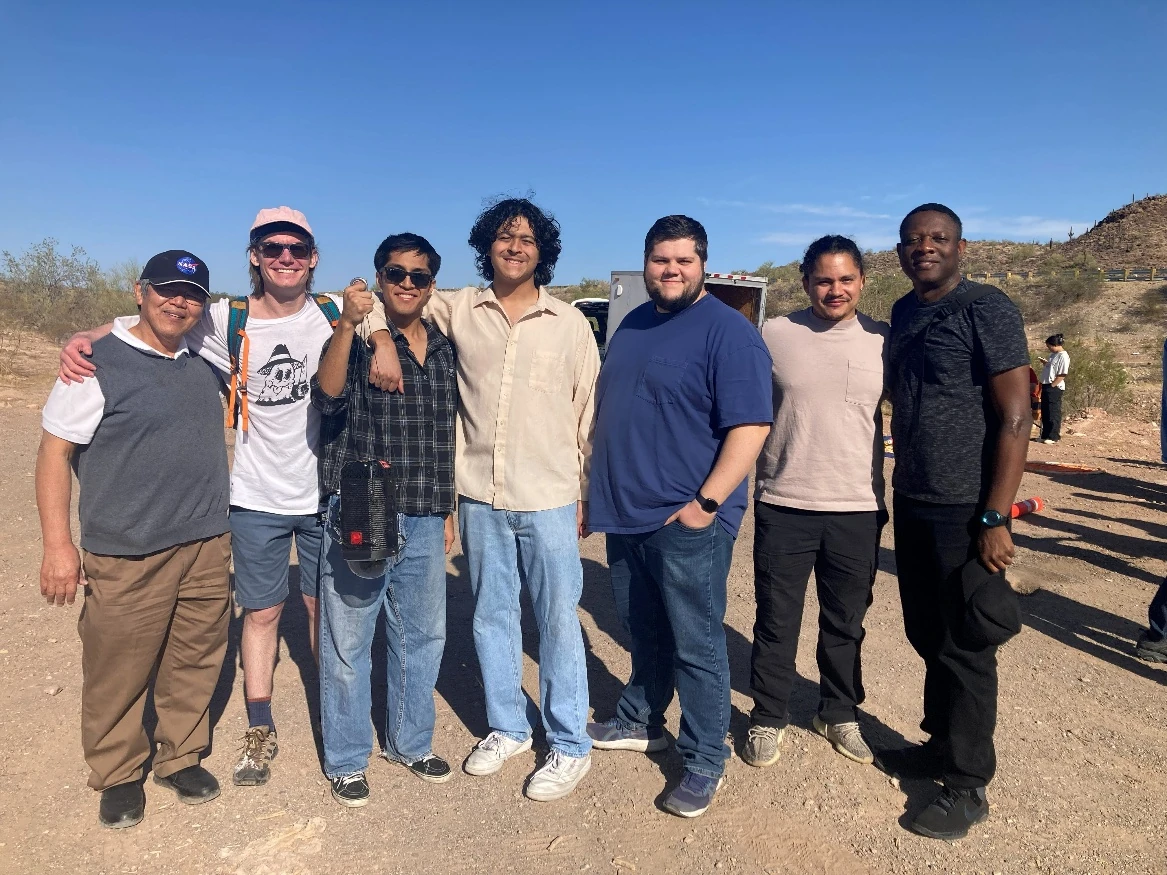
Spring 2025 · Team photograph
From left to right: Ed Ong, Ethan Pierson, Elvis Garcia, Rafael Sanchez, Adam Fuge, Marquiz Muza, Nate Okafor.
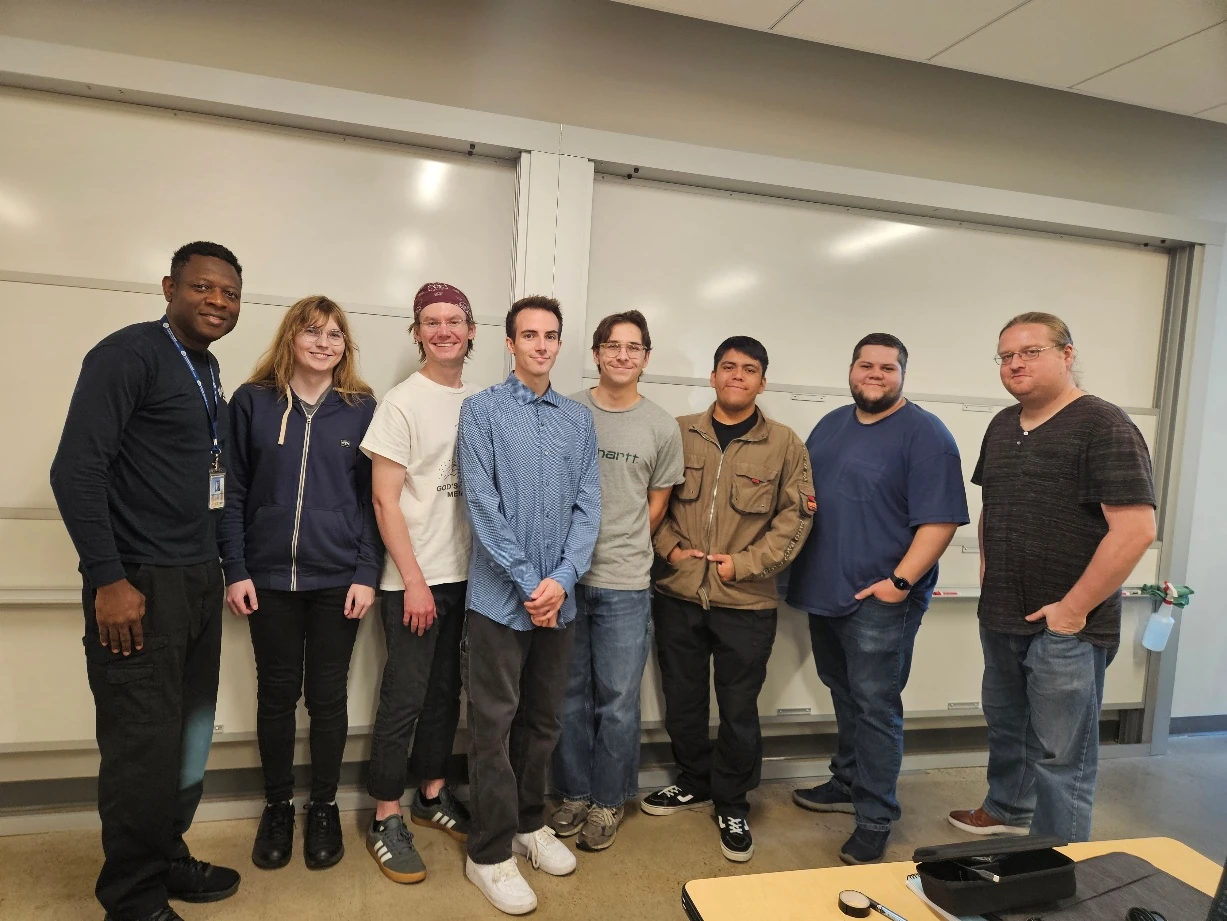
Fall 2025 · Team photograph
From left to right: Nate Okafor, Emma Landis, Ethan Pierson, Preston Furulie, Loukos Stevenson, Jose Ocampo, Adam Fuge, Garrett Nordmeyer.
Three short excerpts from the team’s edited Fall 2025 summary film. These are recorded camera views, not a continuous flight recording or a GPS-synchronized replay.
18-second excerpt · The camera leaves the launch area and rises above the landscape.
8-second excerpt · The summary film’s balloon-burst sequence shows the transition into descent.
7-second excerpt · The camera descends into vegetation. This view alone does not establish a verified touchdown time.